Brillouin Diversity Index Calculator
Free online calculator for the Brillouin diversity index (H) — ideal for finite communities, small samples, and complete censuses in ecology and biodiversity research.
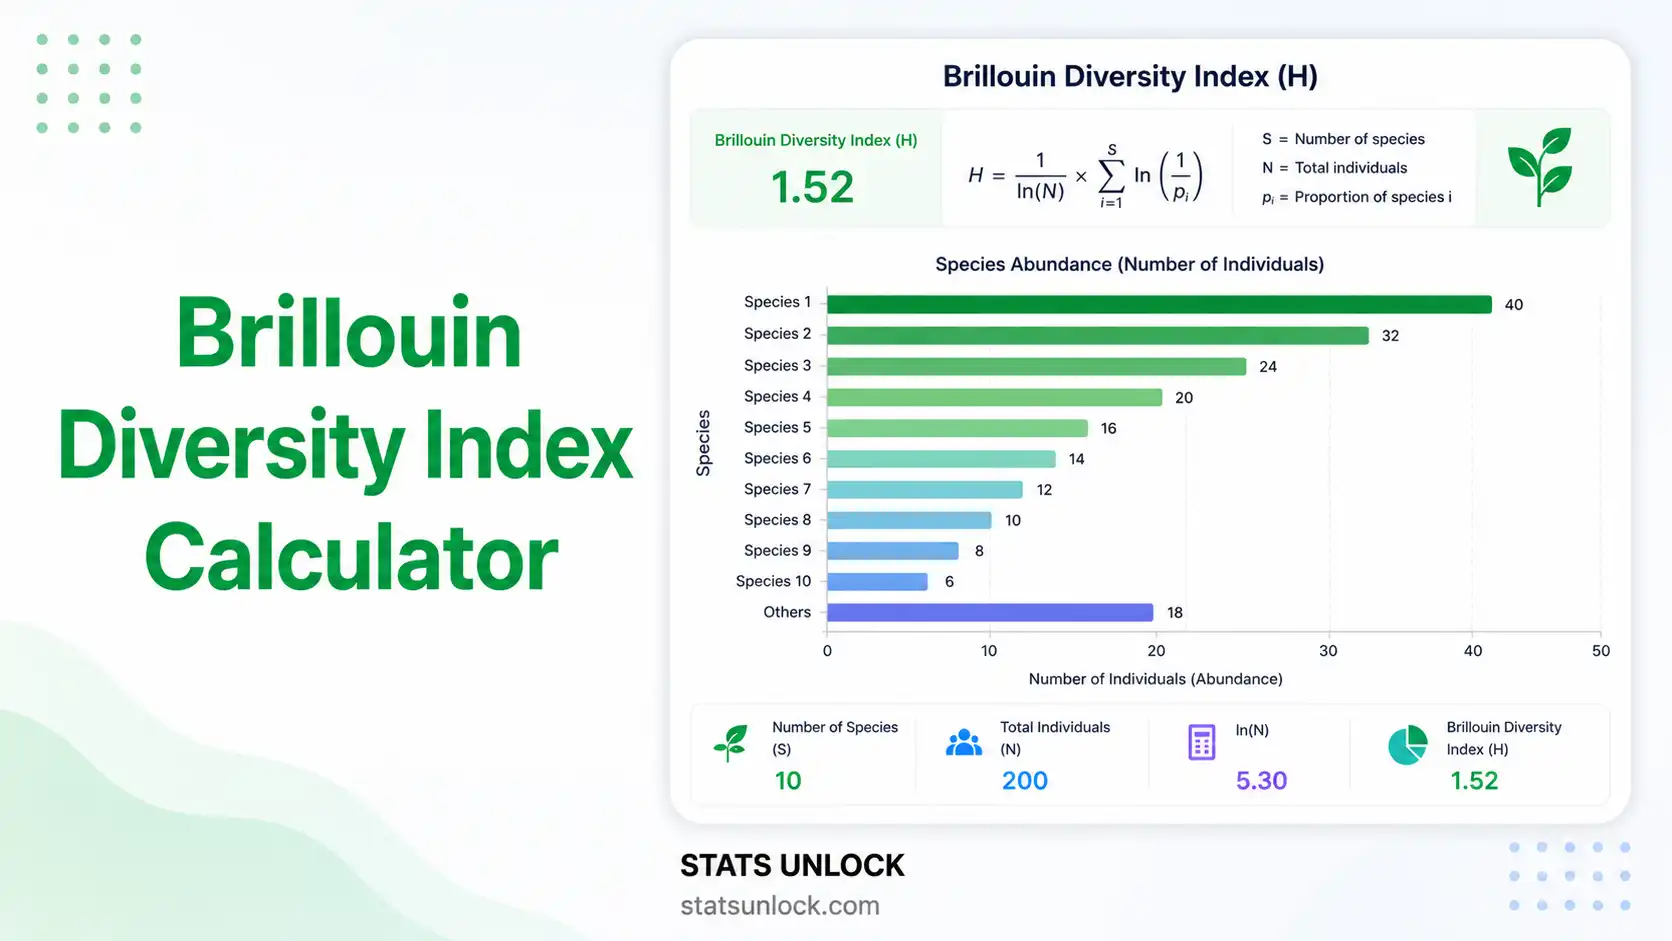
📊 Enter Your Data
Comma- or newline-separated integer counts. Each value = number of individuals of one species.
Supports .csv, .txt, .xlsx, .xls — headers detected automatically.
0 species entered
⚙️ Configuration
Auto-fills throughout reports and poster.
📈 Results
Brillouin Diversity Equation
The Brillouin index (H) for a finite community is calculated as:
- H — Brillouin diversity index (information content of the community).
- N — Total number of individuals in the community (Σ ni).
- ni — Number of individuals of species i.
- S — Total number of species (richness).
- ! — Factorial. ln — natural logarithm (or log2 / log10 if selected).
- Hmax = (1/N) · ln[ N! / ((N/S)!S−r · ((N/S)+1)!r) ], where r = N − S·⌊N/S⌋
- Evenness E = H / Hmax (ranges 0 to 1).
Detailed Results
📊 Four Visualizations
🔍 Detailed Interpretation of Results
📝 How to Write Your Results in Research
Five publication-ready reporting templates auto-filled with your computed values. Click 📋 Copy to copy any example.
🪧 Research Poster Panel — Advanced & Detailed
🎯 Detailed Conclusion
📌 When to Use the Brillouin Diversity Index
Use Brillouin's H when:
- ✓ Your data represent a complete census (not a sample of a larger population).
- ✓ You have integer counts per species (not proportions or rates).
- ✓ Your sample is small (Shannon's H' becomes biased for small N).
- ✓ Sampling is non-random (laboratory cultures, controlled plots, museum collections).
- ✓ You want a more conservative diversity estimate than Shannon-Wiener.
Avoid Brillouin when:
- ✗ You are sampling from a much larger community (use the Shannon-Wiener Index Calculator instead).
- ✗ Counts are not integers (e.g., biomass, basal area — use the Simpson's Diversity Index Calculator).
- ✗ Sites differ in sampling effort (use rarefaction first; pair with the Species Richness Calculator and Evenness Index Calculator).
Real-world examples: Insect trap collections, museum bird study skins, controlled greenhouse plant censuses, soil core invertebrate counts, gut microbiome OTU surveys, captive zoo population assessments.
💡 Tip: Compute the relative abundance of each species first to understand community structure before applying any diversity index.
📖 How to Use This Tool — Step-by-Step
- Enter Data — Type / paste counts (comma or newline), upload a CSV/Excel file, or use the manual entry table. Example:
52, 48, 55, 61, 47. - Pick a Sample Dataset — Five real-world ecological datasets are included to explore Brillouin behaviour across high, moderate, low, and very-high diversity scenarios.
- Set the Group Name — Type your study site, plot, or community name. It auto-fills throughout the report and poster.
- Choose Log Base — Natural log (ln) is standard in ecology. Log2 reports H in bits (information theory). Log10 for older literature.
- Click Calculate — Computes H, Hmax, evenness, S, N, and per-species proportions.
- Read Summary Cards — Green = high diversity, amber = moderate, red = low diversity.
- Examine Four Charts — Rank-abundance curve (dominance), donut (composition), bar (raw counts), radar (diversity profile).
- Read Interpretation — Plain-language explanation tailored to your numerical result.
- Copy a Reporting Example — Five styles: journal, thesis, plain-language, conference abstract, monitoring report.
- Export — Download a Word-compatible .txt summary or a print-ready PDF.
❓ Frequently Asked Questions
Q1. What is the Brillouin Diversity Index and when should I use it?
The Brillouin Diversity Index (H) is an information-theoretic measure of species diversity for finite or fully censused communities. Unlike Shannon-Wiener H', which estimates diversity from a sample of an infinite population, Brillouin computes the exact diversity of a known community using factorials.
Use Brillouin when your data represent a complete census (e.g., all insects in a trap, all trees in a fixed plot), when sampling is non-random, or when sample sizes are too small for Shannon's estimator to be reliable.
Q2. What data do I need to calculate Brillouin's H?
You need integer counts of individuals per species. Brillouin requires whole numbers — proportions, biomass, or basal area cannot be used. Provide at least two species and a minimum of about 10 individuals total for a meaningful result. The tool accepts comma-separated values, newline-separated values, or uploaded CSV/Excel columns.
Q3. What does a high vs. low Brillouin value mean?
H below 1.0 indicates low diversity (few species or strong dominance). H between 1.0 and 2.0 is moderate, typical of disturbed or recovering habitats. H of 2.0 to 3.0 is high diversity, characteristic of intact temperate ecosystems. H above 3.0 represents very high diversity, common in tropical forests and coral reefs.
A higher H always means greater information content per individual — both more species and a more even distribution among them.
Q4. How does Brillouin differ from Shannon-Wiener?
Shannon's H' = −Σ pi ln(pi) treats the sample as drawn from an infinite community and uses proportions. Brillouin's H uses factorials and treats the data as the entire community. Brillouin always returns slightly lower values than Shannon for the same dataset because it accounts for the finite, exact nature of the count.
Choose Shannon for samples of larger populations and Brillouin for closed communities or small censuses.
Q5. What are the assumptions and limitations?
Brillouin assumes integer counts, complete detection of all species, and a closed (finite) community. It is sensitive to sampling effort and cannot be directly compared between sites of different sizes without standardisation. Like all single-number diversity indices, it cannot distinguish whether changes are driven by richness, evenness, or both — always report Hmax and evenness alongside H.
Q6. How much sampling effort is needed?
Although Brillouin can be computed on any sample size (it is exact, not estimated), ecological reliability requires at least 30 individuals across 5 or more species. For community comparisons, plot a species accumulation curve to confirm sampling is approaching saturation. Camera-trap and trapping studies should standardise effort across sites before computing H.
Q7. Can I compare Brillouin values between sites?
Yes — but only when sampling effort, season, and taxonomic resolution are matched. Otherwise apply rarefaction or compute Hill numbers (q = 0, 1, 2) which are designed for cross-site comparison. Raw H values from different studies should never be compared without standardisation.
Q8. How do I report Brillouin's H in a research paper?
Report H, Hmax, evenness E, species richness S, and total individuals N together. A standard journal sentence is: "Brillouin diversity was H = 2.84 (Hmax = 3.18, E = 0.89) for 24 species and 412 individuals." See the five reporting examples in the Results section above for journal, thesis, plain-language, abstract, and monitoring formats.
Q9. Can I use this calculator for a thesis or peer-reviewed paper?
Yes for educational use, exploratory analysis, and class assignments. For peer-reviewed publication, validate the computed values in R (vegan or QSBio packages) or PRIMER-E and cite this calculator: Stats Unlock (2026). Brillouin Diversity Index Calculator. Retrieved from https://statsunlock.com
Q10. My H value seems unexpectedly high or low — what could be wrong?
Check for non-integer values, missing or undetected species, very small N, or one species dominating the count. Confirm that the data really is a complete census — if it is a sample of a much larger community, switch to Shannon-Wiener. Also verify that the correct column was selected during file upload and that decimal commas were not misread as separators.
🔬 Technical Notes — Formula Derivation, Assumptions & Implementation
Mathematical Derivation
Brillouin (1956) derived H from Shannon's information theory by treating the community as a finite multiset. The number of distinguishable arrangements of N individuals across S species (with ni individuals of species i) is the multinomial coefficient W = N! / (n1! · n2! · … · nS!). Brillouin's H is the per-individual information content of this arrangement:
H = (1/N) · ln(W) = (1/N) · [ln(N!) − Σ ln(ni!)]
Numerical Implementation
Direct factorial computation overflows for N > 170 in IEEE-754 double precision. This calculator uses logarithm-of-gamma via Stirling's series for log-factorials, ensuring numerical stability up to N > 1,000,000 individuals.
ln(k!) = lgamma(k + 1)
Assumptions
- Counts are non-negative integers.
- The community is closed and fully censused.
- All species are detected (no detection bias).
- Species are taxonomically distinct and consistently identified.
Limitations
- H values from samples with different N are not directly comparable.
- Cannot decompose richness vs. evenness contributions on its own.
- Sensitive to taxonomic lumping/splitting decisions.
- Does not incorporate phylogenetic or functional information.
🔗 Related Diversity & Ecology Calculators
Explore other free biodiversity and community ecology calculators on Stats Unlock. Each pairs naturally with the Brillouin Diversity Index for fuller analysis of your dataset.
📚 References
The following references support the statistical and ecological methods used in this Brillouin Diversity Index calculator, covering biodiversity measurement, species abundance distributions, and best practices in ecological sampling.
- Brillouin, L. (1956). Science and Information Theory. Academic Press, New York.
- Shannon, C. E., & Weaver, W. (1949). The Mathematical Theory of Communication. University of Illinois Press.
- Pielou, E. C. (1966). The measurement of diversity in different types of biological collections. Journal of Theoretical Biology, 13, 131–144. https://doi.org/10.1016/0022-5193(66)90013-0
- Magurran, A. E. (2004). Measuring Biological Diversity. Blackwell Publishing. Publisher page
- Krebs, C. J. (1999). Ecological Methodology (2nd ed.). Benjamin Cummings.
- Hill, M. O. (1973). Diversity and evenness: A unifying notation and its consequences. Ecology, 54(2), 427–432. https://doi.org/10.2307/1934352
- Jost, L. (2006). Entropy and diversity. Oikos, 113(2), 363–375. https://doi.org/10.1111/j.2006.0030-1299.14714.x
- Chao, A., & Jost, L. (2012). Coverage-based rarefaction and extrapolation. Ecology, 93(12), 2533–2547. https://doi.org/10.1890/11-1952.1
- Peet, R. K. (1974). The measurement of species diversity. Annual Review of Ecology and Systematics, 5, 285–307. https://doi.org/10.1146/annurev.es.05.110174.001441
- Buzas, M. A., & Hayek, L. C. (1996). Biodiversity resolution: An integrated approach. Biodiversity Letters, 3(2), 40–43. https://doi.org/10.2307/2999767
- Gotelli, N. J., & Colwell, R. K. (2001). Quantifying biodiversity: Procedures and pitfalls in the measurement and comparison of species richness. Ecology Letters, 4(4), 379–391. https://doi.org/10.1046/j.1461-0248.2001.00230.x
- Oksanen, J., et al. (2022). vegan: Community Ecology Package. R package version 2.6-4. https://CRAN.R-project.org/package=vegan
- R Core Team. (2024). R: A Language and Environment for Statistical Computing. R Foundation for Statistical Computing. https://www.R-project.org/
- Colwell, R. K. (2013). EstimateS: Statistical estimation of species richness and shared species from samples (version 9). http://purl.oclc.org/estimates
- Stats Unlock. (2026). Brillouin Diversity Index Calculator. https://statsunlock.com/tools/brillouin-diversity-index-calculator


