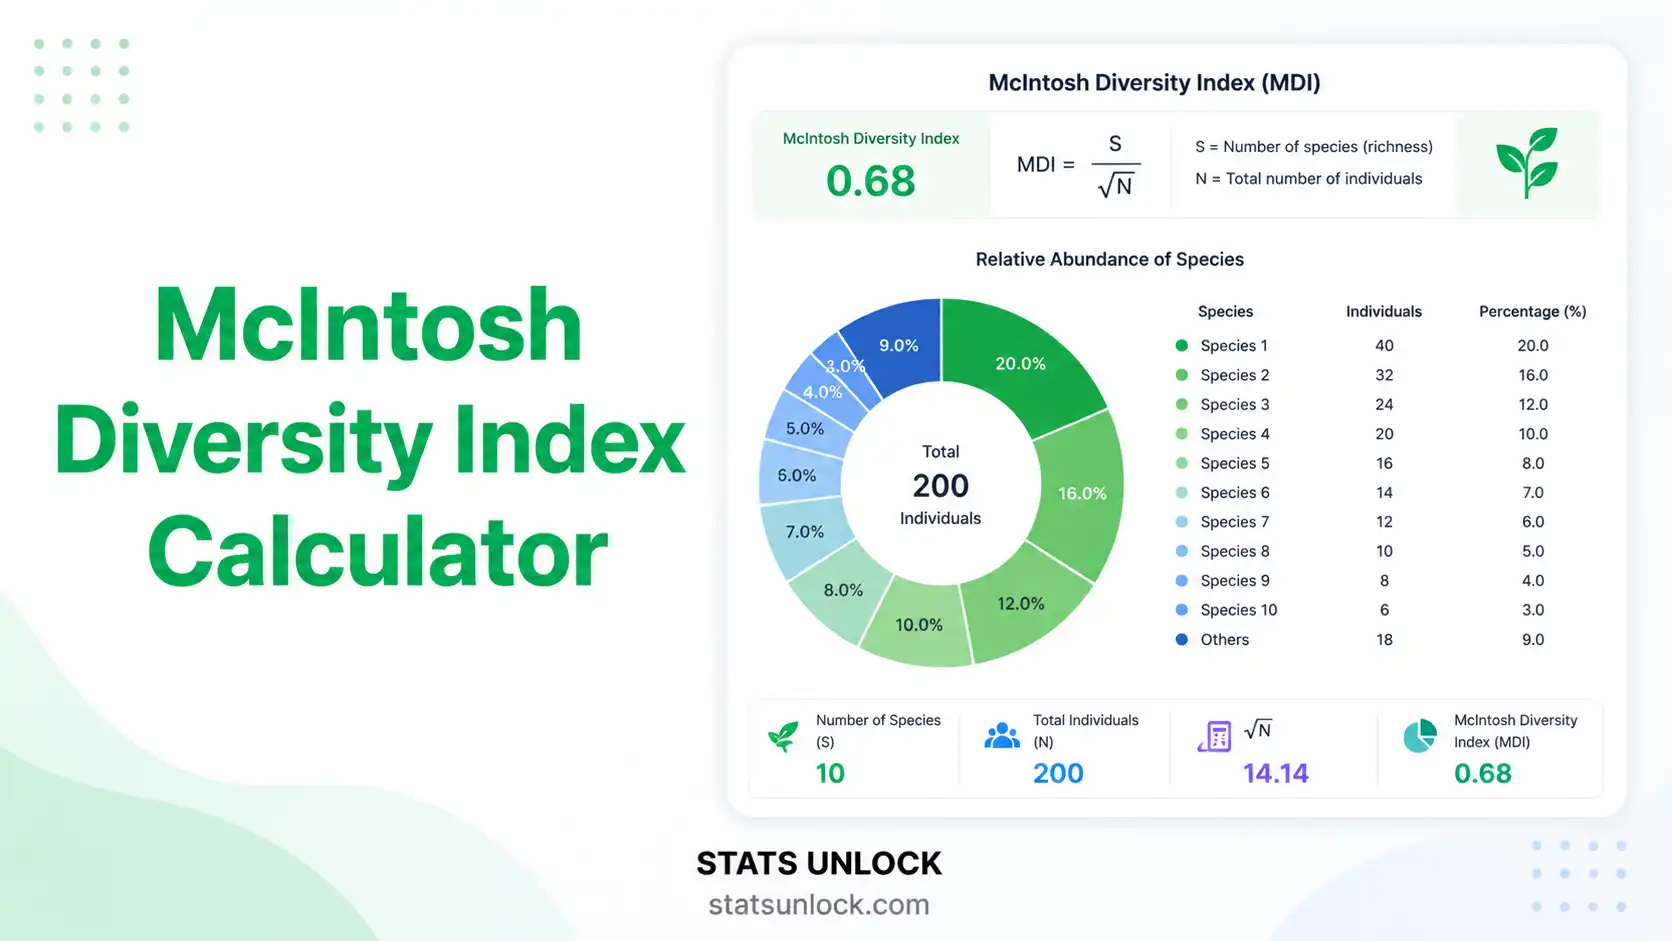
McIntosh Diversity Index Calculator
A free online ecology tool to compute McIntosh's diversity (D), dominance (U) and evenness (E) from species count data — with charts, formulas and publication-ready reports for biodiversity research.
📊 Step 1 — Enter Species Count Data
Add as many species rows as you need. Click "Use This Table" to apply.
⚙️ Step 2 — Analysis Settings
McIntosh Diversity Index Equations
The McIntosh (1967) family of indices is computed in three steps:
- U — McIntosh's dominance measure; the Euclidean distance of the community vector from the origin in species-count space.
- D — McIntosh's diversity index, normalized to the range 0 to 1 (1 = perfectly even, 0 = single-species dominance).
- E — McIntosh's evenness, also bounded 0 to 1.
- ni — count of individuals in species i.
- N — total individuals across all species (= ∑ ni).
- S — species richness (number of species with non-zero count).
- ∑ — summation across all species i = 1 to S.
📈 Step 3 — Visualization (4 Plots)
Four colorful plots that summarise the species-abundance distribution and diversity decomposition for the input community.
1. Rank-Abundance (Whittaker) Plot
2. Proportional Abundance (Donut)
3. nᵢ² Contribution to U (Bar)
4. Diversity Gauge — D, E, J'
📋 Full Results Table
| Statistic | Value | Description |
|---|
Per-species contributions
| # | Species / Group | nᵢ | pᵢ | nᵢ² | % of U² |
|---|
⬇️ Download Results
💡 Plain-Language Interpretation
Subsection 1 — Detailed Interpretation Results
Subsection 2 — How to Write Your Results in Research
Five ready-to-paste reporting templates in different research styles. All values are auto-filled from your latest analysis. Click "📋 Copy" to grab the version you need.
🪧 Research Poster Panel
A print-ready, advanced poster panel auto-generated from your analysis — title bar, four content zones, dominant results panel, conclusions and footer. Designed for A0 / A1 academic conference posters.
🌿 Detailed Conclusion
📐 When to Use the McIntosh Diversity Index
Decision Checklist — Use the McIntosh Index when:
- ✓ You have integer counts of individuals per species (or per group / category).
- ✓ You want a diversity value bounded between 0 and 1 — easy to plot, easy to compare.
- ✓ Sampling effort is reasonably standardized across plots / sites you want to compare.
- ✓ You need a metric less inflated by rare species than Shannon-Wiener H'.
- ✓ You are doing community ecology, vegetation plot work, or invertebrate sweep / pitfall trap surveys.
- ✗ Avoid when detection is highly imperfect (use occupancy models instead).
- ✗ Avoid when N differs by an order of magnitude across sites without rarefaction.
Real-World Field Examples
- Vegetation plot survey — a 0.1-ha forest plot with 12 tree species, computing D as a single-number summary of stand diversity for a forestry inventory report.
- Camera trap mammal communities — ranked counts of mid-large mammal detections from 60-day deployments, using D to compare disturbed vs. control plots.
- Aquatic invertebrate survey — taxa abundances from kick-net samples, where rare taxa would dominate H' but McIntosh D gives a more conservative dominance signal.
- Pollinator transect — flower-visitor counts during 30-min transect walks; D and E used together to detect community evenness shifts under management treatments.
Related Metrics — Decision Tree
Need a single 0-to-1 diversity number? → McIntosh D
  → Want to weight rare species more? → Shannon-Wiener H'
  → Want to weight dominant species more? → Simpson's D / Berger-Parker
  → Want integer-friendly metric across orders? → Hill Numbers
  → Need confidence intervals? → Bootstrap McIntosh D
  → Comparing communities with unequal effort? → Rarefy first, then McIntosh D
Related Biodiversity Calculators on Stats Unlock
McIntosh's D works best alongside complementary diversity metrics. Pair this calculator with the related tools below to build a complete biodiversity profile of your community.
📚 How to Use This Tool — 10-Step Walkthrough
STEP 1 — Enter Your Data. Use the Paste tab for quick comma-separated input (e.g., 52, 48, 55, 61, 47). For named species use Column Entry mode. For spreadsheet data switch to the Upload tab; for manual table editing use the Manual tab.
STEP 2 — Choose a Sample Dataset. The dropdown offers five real-world ecological scenarios — pick one to verify the tool is working before substituting your data.
STEP 3 — Configure Analysis Settings. Optionally enter the Study Area / Site / Community Name — it appears throughout the report. Edit the Group Name (default "Birds") to match your taxon. Choose decimal places and evenness variant.
STEP 4 — Run the Analysis. Click Calculate McIntosh Diversity Index. The tool computes U, D and E plus species richness S, total N, evenness, dominance, and Shannon H' for cross-comparison.
STEP 5 — Read the Summary Cards. Green = high diversity (D ≥ 0.70), amber = moderate (0.40 ≤ D < 0.70), red = low (D < 0.40). The colour reflects ecological tier, not statistical confidence.
STEP 6 — Read the Full Results Table. Every metric is reported with a one-line description so you do not have to look up notation. The per-species table shows each species' contribution to U².
STEP 7 — Examine the Four Plots. The rank-abundance plot shows dominance shape; the donut shows proportional abundance; the bar plot decomposes nᵢ² into U; the gauge plot shows D, E and Pielou's J' side-by-side.
STEP 8 — Read the Plain-Language Interpretation. Three to five paragraphs translate the numbers into ecological meaning, suitable for a park-management report or thesis chapter introduction.
STEP 9 — Copy a Reporting Example. Five copy-ready styles cover ecology journals, theses, plain-language briefs, conference abstracts, and long-term monitoring reports. Hit "📋 Copy" on the version you need.
STEP 10 — Export Your Results. "Download Doc" generates a plain-text .txt report (great for emailing). "Download PDF" produces a print-ready A4 PDF including all sections, ideal for archiving or supplementary material.
❓ Frequently Asked Questions
Q1. What is the McIntosh Diversity Index and when should I use it?
The McIntosh Diversity Index, proposed by Robert P. McIntosh in 1967, is a biodiversity metric based on the Euclidean distance from a community to the origin in n-dimensional species-count space. It produces a dominance value U and a normalized diversity D bounded between 0 and 1. Use it whenever you have absolute species counts and want a metric that is mathematically simple, sample-size aware, and intuitive for community ecology, vegetation surveys, or invertebrate sampling.
Q2. What data do I need to calculate the McIntosh Index?
You need integer or decimal counts of individuals for two or more species. The Paste tab accepts comma-separated values like 52, 48, 55, 61, 47. The Upload tab accepts .csv, .txt, .xlsx and .xls — pick the numeric column you want to analyse. The Manual tab lets you type species names alongside counts in a small grid. A minimum of N ≥ 30 individuals across S ≥ 3 species is recommended.
Q3. What does a high vs low McIntosh D value mean ecologically?
D close to 1.0 signals high diversity — many species with relatively even abundances and weak dominance. D close to 0 signals low diversity — strong dominance by one or two species. As a working rule for terrestrial communities: D < 0.40 = low, 0.40 to 0.70 = moderate, > 0.70 = high. Tropical forest bird communities and intact wetlands often score above 0.75; degraded fragments often fall below 0.50.
Q4. How does McIntosh D differ from Shannon H' and Simpson's D?
Shannon-Wiener H' is entropy-based and gives extra weight to rare species. Simpson's D is a probability of two random individuals being from different species — heavily influenced by dominants. The McIntosh Index is geometric: it measures distance from the species-count origin. It is less sensitive to extreme dominance than Simpson and less inflated by rare species than Shannon. Choose McIntosh when you want a clean 0-to-1 number with a sample-size correction baked in.
Q5. What are the assumptions and limitations of the McIntosh Index?
Assumptions: counts are non-negative, sampling is random, the community is closed, and detection is consistent across species. Limitations: U scales with √N so raw values are hard to compare across studies with very different effort. Use the normalized D for comparisons, and rarefy to a common N when sites differ widely. The index does not correct for imperfect detection — for cryptic taxa use occupancy or N-mixture models.
Q6. How much sampling effort do I need for the McIntosh Index to be reliable?
Practical minimums: at least 30 individuals across at least 3 species. For robust community-level inference aim for 100 or more individuals across 5+ species. Always plot a species accumulation curve — if new species are still being added at your final sample size, the index value is unstable and you need more sampling. For camera traps, aim for ≥ 1,000 trap nights for medium-large mammal communities.
Q7. Can I compare McIntosh D between sites or time periods?
Yes, when sampling effort is standardized — same protocol, similar N, same taxonomic group, same season. If N differs widely, rarefy to a common sample size before comparing. For statistical comparisons, generate bootstrap confidence intervals (1,000 or more resamples) rather than treating the point estimate as a fixed number. Report both raw D and rarefied D where relevant.
Q8. How do I report the McIntosh Diversity Index in an ecology journal?
Report U, D, E, S and N together. Example: "McIntosh diversity D = 0.74 (U = 142.3, E = 0.81, S = 12, N = 540)". Cite McIntosh (1967) as the original methodological reference and Magurran (2004) for a textbook discussion of comparative diversity measures. See Section 2.7 above for five complete reporting templates covering ecology journals, theses, policy briefs, conference abstracts, and long-term monitoring reports.
Q9. Can I use this calculator for published research or a thesis?
Yes for exploratory analysis, learning, draft figures, and report writing. For peer-reviewed publications, cross-check the result with the R vegan package or PRIMER-E. Cite the tool as: Stats Unlock. (2025). McIntosh Diversity Index Calculator. Retrieved from https://statsunlock.com/tools/mcintosh-diversity-index/.
Q10. My McIntosh D value seems unexpectedly high or low — what could be wrong?
Common causes: (1) one species with extreme counts is depressing D — check the rank-abundance plot; (2) effort was too low and dominants are over-represented; (3) a numeric column from your spreadsheet was misread — check the column picker preview; (4) zero-count species are inflating S; (5) abundances were entered as percentages instead of raw counts. Reload Sample Dataset 1 and verify the tool is computing as expected, then re-enter your data carefully.
📚 References
The following references support the methods used in this calculator, covering biodiversity index theory, diversity measurement, and ecological sampling best practices.
- McIntosh, R. P. (1967). An index of diversity and the relation of certain concepts to diversity. Ecology, 48(3), 392–404. https://doi.org/10.2307/1932674
- Shannon, C. E., & Weaver, W. (1949). The mathematical theory of communication. University of Illinois Press.
- Simpson, E. H. (1949). Measurement of diversity. Nature, 163, 688. https://doi.org/10.1038/163688a0
- Magurran, A. E. (2004). Measuring biological diversity. Blackwell Publishing.
- Krebs, C. J. (1999). Ecological methodology (2nd ed.). Benjamin Cummings.
- Hill, M. O. (1973). Diversity and evenness: A unifying notation and its consequences. Ecology, 54(2), 427–432. https://doi.org/10.2307/1934352
- Pielou, E. C. (1966). The measurement of diversity in different types of biological collections. Journal of Theoretical Biology, 13, 131–144. https://doi.org/10.1016/0022-5193(66)90013-0
- Jost, L. (2006). Entropy and diversity. Oikos, 113(2), 363–375. https://doi.org/10.1111/j.2006.0030-1299.14714.x
- Gotelli, N. J., & Colwell, R. K. (2001). Quantifying biodiversity: Procedures and pitfalls in the measurement and comparison of species richness. Ecology Letters, 4(4), 379–391. https://doi.org/10.1046/j.1461-0248.2001.00230.x
- Heip, C. H. R., Herman, P. M. J., & Soetaert, K. (1998). Indices of diversity and evenness. Océanis, 24(4), 61–87. https://www.vliz.be/imisdocs/publications/100093.pdf
- Oksanen, J., Simpson, G. L., Blanchet, F. G., et al. (2024). vegan: Community ecology package. R package version 2.6-6. https://CRAN.R-project.org/package=vegan
- Chao, A., & Jost, L. (2012). Coverage-based rarefaction and extrapolation: Standardizing samples by completeness rather than size. Ecology, 93(12), 2533–2547. https://doi.org/10.1890/11-1952.1
- R Core Team. (2024). R: A language and environment for statistical computing. R Foundation for Statistical Computing. https://www.R-project.org/
- Smith, B., & Wilson, J. B. (1996). A consumer's guide to evenness indices. Oikos, 76(1), 70–82. https://doi.org/10.2307/3545749


