Relative
Abundance Calculator
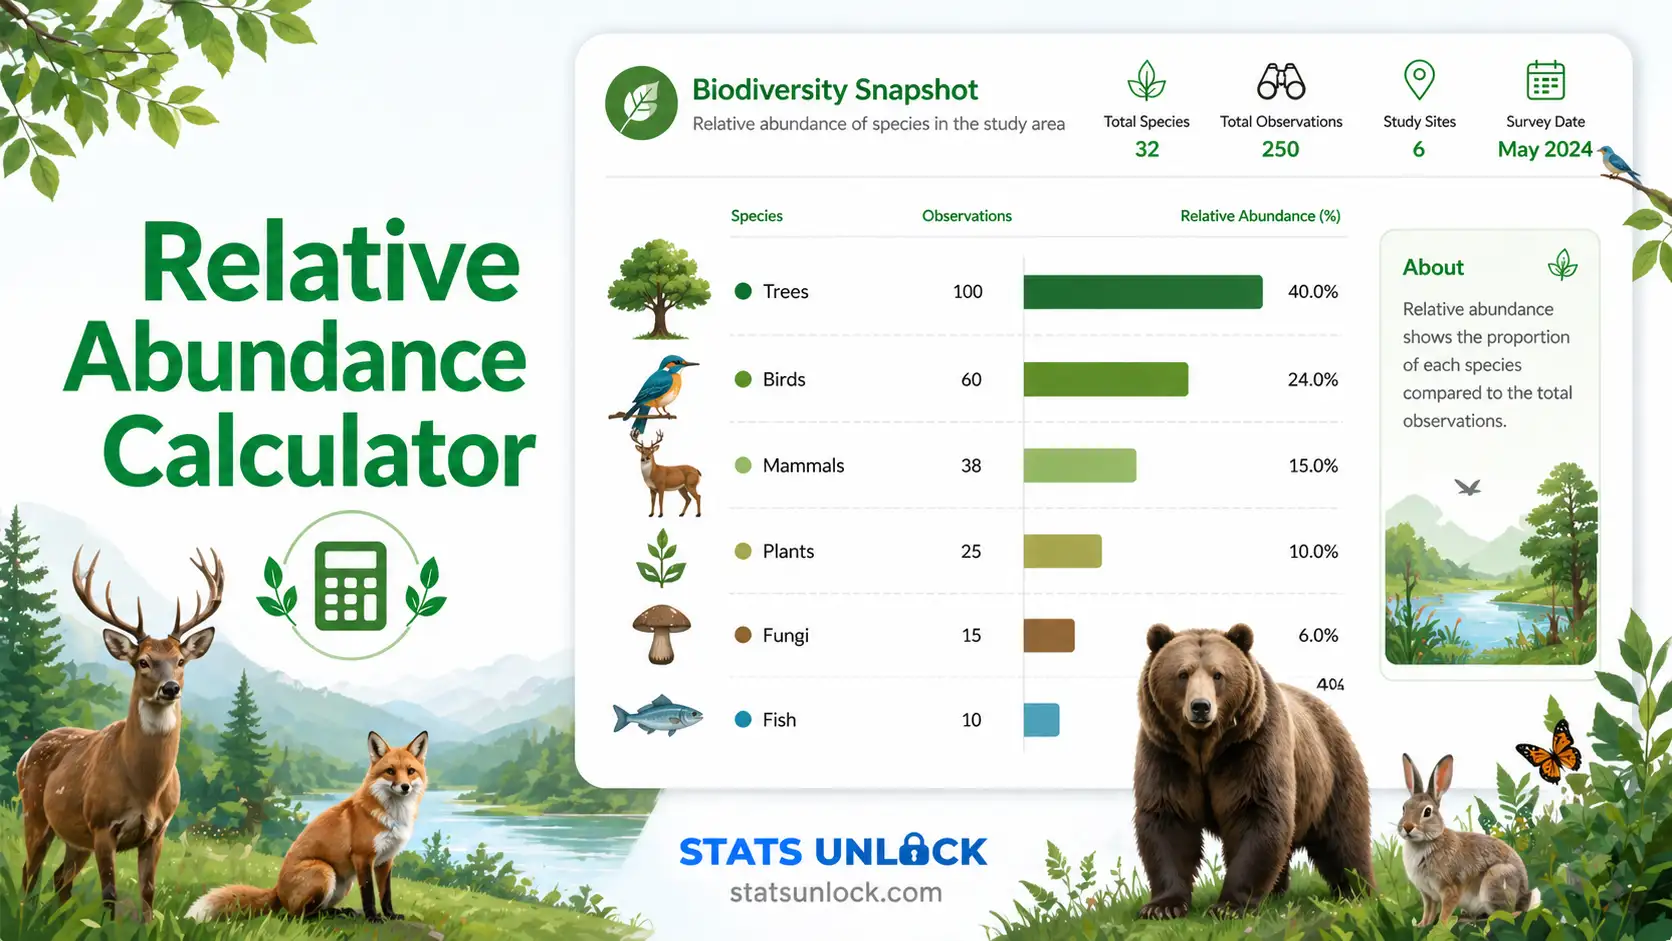
Calculate the proportional contribution of each species to your community — free, instant, and publication-ready.
📊 Data Input & Configuration
Enter comma-separated counts (one value per species). Example: 52, 48, 55, 61, 47, ...
Supports .csv, .txt, .xlsx, .xls — select a Species column (labels) and a Values column (counts).
Number of species/groups:
🧭 When to Use Relative Abundance
- You want to compare the dominance of species within a community sample
- You have count data from transects, point counts, camera traps, or quadrats
- You are reporting community composition in a research paper or monitoring report
- You need to rank species from most dominant to rarest
- You want to track shifts in species composition across sampling periods
- Sample sizes differ between sites, making absolute counts incomparable
- You need actual population size estimates — use mark-recapture or distance sampling instead
- Detection probability varies greatly among species — this method assumes equal detectability
- You have fewer than 10 total individuals — values will be highly unstable
🔗 Related Tools on StatsUnlock
🌿
🦋
🌳
⚖️
Shannon-Wiener Index
Measures overall species diversity accounting for both richness and evenness
Use when → you need an H' diversity score ↗
Simpson's Diversity Index
Probability that two random individuals belong to different species
Use when → you need dominance / D score ↗
Species Richness Calculator
Total count of distinct species in a sample — Margalef's D and more
Use when → you need raw species count ↗
Evenness Index Calculator
Pielou's J — how evenly individuals are distributed across species
Use when → you need Pielou's J score ↗
🛠️ How to Use This Calculator
- 1Enter your Study Area or Site Name (optional but recommended — it personalises all output text)
- 2Select a sample dataset from the dropdown to pre-load realistic ecological data, or clear it and enter your own
- 3Choose your preferred input mode: Free Text (paste comma-separated values), Column Entry (species name + count pairs), Upload File (.csv/.xlsx), or Manual Table
- 4In Free Text mode, enter count values separated by commas: e.g.
52, 48, 55, 61, 47, 39 - 5In Column Entry mode, type the species label in the left column and the individual count in the right column — add rows as needed
- 6Configure Sort Order (by RA descending, ascending, name, or input order) and Decimal Places (1–4)
- 7Click ⚡ Calculate Relative Abundance to run the analysis
- 8Review the summary cards, results table, and charts — species are colour-coded by dominance tier
- 9Read the detailed interpretation and copy from the writing examples for your paper, thesis, or report
- 10Download a plain-text report (.txt) or PDF for your records or supplementary materials
Worked Example: A forest bird survey recorded 8 species with counts [52, 48, 55, 61, 47, 39, 28, 71]. Total N = 401. The most abundant species had RA = 71/401 × 100 = 17.71%. The rarest had RA = 28/401 × 100 = 6.98%. The community showed moderate equitability — no single species exceeded 18% RA.
⚙️ Technical Notes
Formula Derivation & Assumptions
Derivation: Relative Abundance (RA) is the simplest measure of proportional representation. For species i with count ni in a community of total size N = Σni, the proportion is pi = ni/N. Relative abundance in percent is RA(i) = pi × 100. By definition, Σpi = 1 and ΣRA(i) = 100%.
Assumptions: (1) All individuals are equally detectable. (2) The sample is representative of the true community. (3) Individuals are correctly assigned to species. (4) Sampling is conducted consistently across all species groups. (5) The total count N > 0.
Assumptions: (1) All individuals are equally detectable. (2) The sample is representative of the true community. (3) Individuals are correctly assigned to species. (4) Sampling is conducted consistently across all species groups. (5) The total count N > 0.
Limitations
Relative abundance does not account for: (1) differential detectability between species (cryptic vs. conspicuous species); (2) spatial heterogeneity within the study area; (3) seasonal or temporal variation if pooling samples across time; (4) body size or biomass differences. It is a proportional measure — an increase in one species' count will automatically decrease the RA of all others even if their absolute counts remain unchanged.
Statistical Uncertainty
For binomial proportions, the 95% confidence interval can be approximated using the Wilson score interval: CI = p ± 1.96 × √(p(1−p)/N). For small samples (N < 30), exact binomial confidence intervals (Clopper-Pearson) are preferred. This tool reports point estimates; for inferential statistics, consult a biostatistician or use dedicated software (R:
binom.test(), binom.confint()).
❓ Frequently Asked Questions
What is relative abundance in ecology?
Relative abundance is the proportional contribution of each species to the total number of individuals in a sampled community, expressed as a percentage. It indicates how dominant or rare a species is relative to all others — not how many individuals actually exist in the landscape.
How do you calculate relative abundance of a species?
Divide the individual count of a species (ni) by the total count of all species (N), then multiply by 100. Formula: RA(i) = (ni / N) × 100. For example, if you recorded 60 individuals of Species A out of 300 total: RA = (60/300) × 100 = 20%.
What is the difference between relative abundance and absolute abundance?
Absolute abundance is the actual count of individuals of a species in a given area (e.g., 60 deer in 100 ha). Relative abundance is the proportion of that species compared to all species combined (e.g., 20% of all mammals detected). Relative abundance is useful for comparisons across sites with different total sample sizes.
What does a high relative abundance value mean?
A high RA (typically >25–30%) indicates the species is dominant in the community — it makes up a large proportion of all individuals observed. This may indicate competitive advantage, high fecundity, or resource preference. Very high RA in a single species can signal reduced biodiversity or ecosystem stress.
Do relative abundance values always sum to 100%?
Yes. By definition, relative abundance values across all species in the community always sum to exactly 100%. Individual species values range from 0% (not detected) to 100% (only species detected). This zero-sum property means an increase in one species' RA automatically reduces others.
How is relative abundance used in wildlife camera trap studies?
In camera trap studies, relative abundance is often expressed as the Relative Abundance Index (RAI) = (number of independent detections / total trap-nights) × 100. This standardises detections for survey effort. Species with higher RAI values are considered more abundant or more frequently active in the study area.
How do I report relative abundance in a research paper?
Report the formula used, total N, number of species, and RA values as percentages (2 decimal places). Include a table showing species, count, and RA%. Visualise with a bar chart or pie chart. State whether species are sorted by dominance and note any exclusions. Use the writing examples in this tool for journal, thesis, and report templates.
What sample size is needed for reliable relative abundance estimates?
A minimum of 30–50 total individuals is generally recommended. For communities with many rare species, larger samples (N > 100) provide more stable proportional estimates. Very small samples (N < 15) produce highly variable RA values and should be interpreted cautiously, with confidence intervals reported.
Can two species have the same relative abundance?
Yes. If two species have identical counts, their RA values will be equal. In a perfectly even community where all species have equal counts, every species would have RA = 100%/S (where S = number of species). This represents maximum evenness and is the theoretical baseline for comparison.
What are the key limitations of relative abundance as a metric?
Key limitations include: (1) does not account for species detectability differences; (2) sensitive to total N — adding or removing one species changes all others' RA; (3) cannot distinguish increases from decreases in community change; (4) does not reflect population density, biomass, or ecological function; (5) may be biased by seasonal sampling, observer skill, or method detectability differences.
📚 References
The relative abundance calculator, relative abundance formula, and biodiversity interpretation guidelines below draw on the following foundational ecology and wildlife research references (APA 7th Edition):
1.Magurran, A. E. (2004). Measuring biological diversity. Blackwell Science.
2.Krebs, C. J. (1999). Ecological methodology (2nd ed.). Benjamin Cummings.
3.Whittaker, R. H. (1965). Dominance and diversity in land plant communities. Science, 147(3655), 250–260.
4.O'Brien, T. G., Kinnaird, M. F., & Wibisono, H. T. (2003). Crouching tigers, hidden prey: Sumatran tiger and prey populations in a tropical forest landscape. Animal Conservation, 6(2), 131–139.
5.Buckland, S. T., Anderson, D. R., Burnham, K. P., Laake, J. L., Borchers, D. L., & Thomas, L. (2001). Introduction to distance sampling. Oxford University Press.
6.Legendre, P., & Legendre, L. (2012). Numerical ecology (3rd English ed.). Elsevier.
7.Kent, M., & Coker, P. (1992). Vegetation description and analysis: A practical approach. Belhaven Press.
8.Pielou, E. C. (1977). Mathematical ecology. Wiley.
9.Otis, D. L., Burnham, K. P., White, G. C., & Anderson, D. R. (1978). Statistical inference from capture data on closed animal populations. Wildlife Monographs, 62, 3–135.
10.MacArthur, R. H., & Wilson, E. O. (1967). The theory of island biogeography. Princeton University Press.
11.Tuomisto, H. (2010). A diversity of beta diversities: Straightening up a concept gone awry. Ecography, 33(1), 2–22.
12.Williams, B. K., Nichols, J. D., & Conroy, M. J. (2002). Analysis and management of animal populations. Academic Press.


