Sign Test Calculator
A free, online non-parametric hypothesis test for the median. Enter one column of comma-separated values, set a hypothesized median, and get the exact binomial p-value, effect size, confidence interval, APA-format results, and colorful publication-ready charts — instantly.
📥 Data Input
⚙️ Test Configuration
📊 Results
Full Results Table
📋 Assumption Checks
🎨 Colorful Visualizations
Distribution of Values vs Hypothesized Median
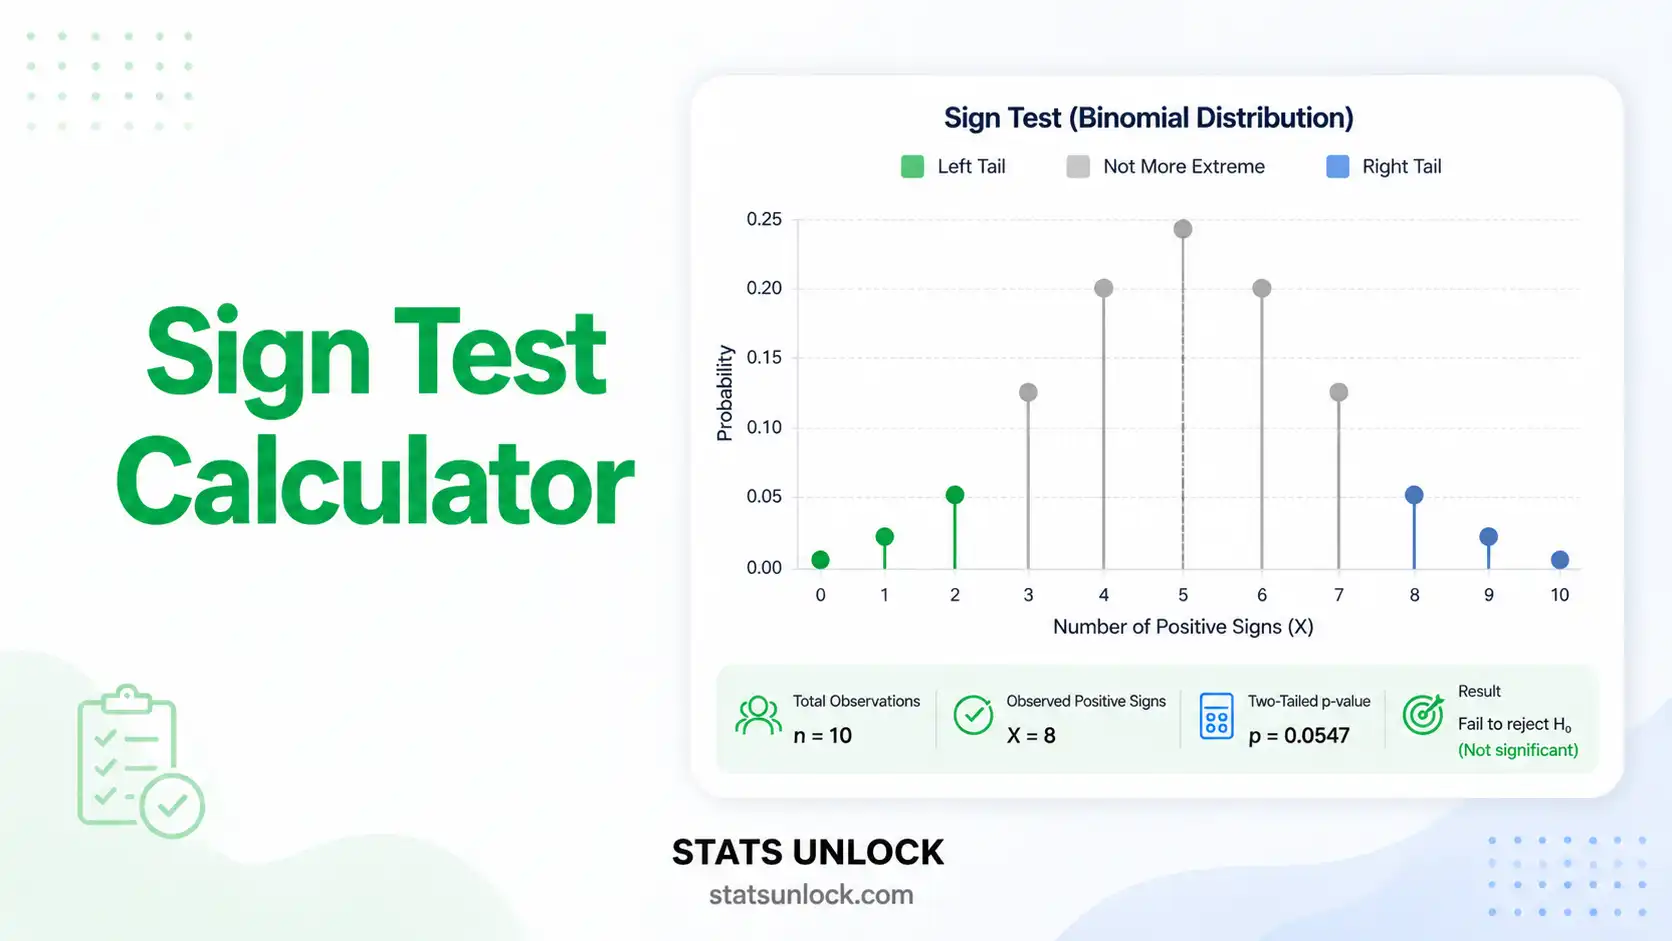
Sign Distribution & Binomial Probability
🧠 Detailed Interpretation Results
✍️ How to Write Your Results in Research (5 Examples)
🏁 Conclusion Section
📐 Technical Notes & Formulas
Formulas Used
1. Sign computation — for each value xᵢ:
2. Test statistic — under H₀ the count of plus signs follows Binomial(n, 0.5):
3. Exact two-tailed p-value:
4. Effect size — proportion of positive differences:
5. Wilson 95% confidence interval for p̂:
6. Hodges–Lehmann median estimate & CI — order statistics of the original data after centering on M₀.
Technical Notes
- Independence — observations must be independent (no clustering, no autocorrelation).
- Measurement scale — at least ordinal so each value can be compared with M₀.
- Ties — values exactly equal to M₀ are discarded (most conservative convention; see Conover, 1999).
- Continuity correction — for n > 25, the normal approximation z = (S − n/2 ± 0.5) / √(n/4) gives nearly identical p-values to the exact binomial.
- Power — the sign test is less powerful than the Wilcoxon signed-rank test when symmetry holds, because it ignores magnitude information.
🎯 When to Use the Sign Test
This free sign test calculator is designed for researchers, students, and data analysts who need a robust, distribution-free test of a population median. Use it whenever you cannot justify the symmetry or normality assumptions required by parametric tests or even by the Wilcoxon signed-rank test.
Decision Checklist
- You have a single sample of numerical or ordinal observations
- You want to test whether the population median equals a hypothesized value
- Data are not normally distributed, or distribution is unknown
- Sample size is small (n as low as 6) and/or contains outliers
- Observations are independent of each other
- Do NOT use if data are symmetric and continuous → the Wilcoxon signed-rank test is more powerful
- Do NOT use if you have two independent groups → use Mann-Whitney U
- Do NOT use if comparing 3+ groups → use Kruskal-Wallis H
Real-World Examples
🏥 Medical / Health
A clinic records pain scores (0–10 scale) for 15 patients after a new therapy and tests whether the median pain score differs from a target value of 4.
📚 Education
An instructor tests whether the median exam score in a small remedial class differs from the school-wide pass mark of 60%.
🌿 Ecology / Wildlife
A field biologist counts the number of plant species in 12 quadrats and tests whether the median richness equals a regional benchmark of 8 species per plot.
💼 Business / Marketing
A small e-commerce site analyses 18 customer satisfaction ratings and tests whether the median score differs from the historical industry median of 50.
Sample Size Guidance
- Minimum recommended n: 6 non-tied observations
- For 80% power to detect p̂ = 0.7 at α = 0.05: n ≈ 30
- For very small effects (p̂ = 0.55): n ≈ 200+
- Discard ties before computing n.
Related Tests — Decision Tree
📘 How to Use This Sign Test Calculator
- Choose your input method — paste data, upload a CSV/Excel file, or enter values manually using the three tabs.
- Edit the Group Name — give your variable a meaningful name (e.g., "Reaction Time" or "Customer Score"). It appears in charts and APA reports.
- Enter or paste your data — comma-separated numbers in the format
52, 48, 55, 61, 47, .... The counter under the textarea shows how many values were detected. - Set the Hypothesized Median (M₀) — the value you want to test against (e.g., 50 for a typical pass mark).
- Pick an Alpha Level — 0.05 is the default; 0.01 is stricter, 0.10 is more lenient.
- Choose a Tail — two-tailed unless you have a directional hypothesis specified before seeing the data.
- Click "Calculate Sign Test" — exact binomial p-value, effect size, CI, charts and reports appear instantly.
- Read the Detailed Interpretation — five auto-filled paragraphs explain what your result means.
- Copy a reporting example — pick APA, thesis, plain-language, abstract, or pre-registration style.
- Download Doc or PDF — both formats include the full report (results, interpretation, APA, references).
❓ Frequently Asked Questions
What is the sign test and when should I use it?
The sign test is one of the simplest non-parametric hypothesis tests. It uses only the signs (positive or negative) of differences between observed values and a hypothesized median, ignoring magnitudes. Use it when your data are ordinal or non-normal, when sample sizes are small, or when you cannot assume the symmetry required by the Wilcoxon signed-rank test. Common applications include before-after measurements, taste-test preferences, and any test of whether a population median differs from a specified value.
What is the p-value in a sign test, and how do I interpret it?
The sign test p-value is the exact binomial probability of observing the obtained number of plus signs (or fewer/more, depending on tail) if the true median equals M₀ and the probability of a plus sign is exactly 0.5. A p-value of 0.03 means there is only a 3% chance of seeing results this extreme by chance alone if the null hypothesis were true. The p-value is not the probability that the null hypothesis is true.
What does statistical significance mean — and does it equal practical importance?
Statistical significance means the observed pattern of signs is unlikely under H₀ (p < α). It does not automatically mean the difference is practically meaningful. With very large samples even tiny departures from M₀ become significant. Always pair the sign test p-value with the proportion of positive signs (p̂) and the median estimate to judge real-world importance.
What is the effect size for a sign test and how do I interpret it?
The most natural effect size is p̂ = S₊ / n, the proportion of positive differences. Values near 0.5 indicate no effect; values near 0 or 1 indicate a strong systematic difference. A useful Cohen-style benchmark is g = |p̂ − 0.5|: g = 0.05 small, 0.15 medium, 0.25 or above large. The 95% Wilson CI for p̂ tells you the precision of this estimate.
What assumptions does the sign test require, and what if my data violate them?
The sign test makes only two assumptions: (1) independence of observations, and (2) at least ordinal measurement. It does not require normality, equal variances, or symmetry. Ties (values exactly equal to M₀) are discarded, reducing the effective sample size. If independence is violated (e.g., autocorrelated time-series data), use a method that accounts for dependence, such as a paired sign test on differenced data.
How large a sample do I need for the sign test to be reliable?
The sign test works with very small samples — n as few as 6 — but has low statistical power when n is small. For 80% power to detect a moderate shift away from the null median (p̂ = 0.7) at α = 0.05, approximately 30 non-tied observations are recommended. With more than 25 observations, the normal approximation with continuity correction matches the exact binomial p-value almost perfectly.
What is the difference between one-tailed and two-tailed sign tests?
A two-tailed sign test detects whether the median differs from M₀ in either direction. A one-tailed test commits to a direction (median > M₀ or median < M₀) before seeing the data, and is more powerful when the direction is correctly specified. Use two-tailed by default unless theory or pre-registration justifies a one-tailed alternative.
How do I report sign test results in APA 7th edition format?
Report the number of positive signs over total non-tied observations, the exact binomial p-value, and the proportion of positive differences. Example: "A sign test indicated that the median customer score differed significantly from 50, S = 16 of 20 positive, p = .012, p̂ = 0.80, 95% CI [0.58, 0.92]." See the "How to Write Your Results" section for five detailed templates.
Can I use this calculator for my published research or university assignment?
Yes — this tool implements the exact binomial sign test as described in Conover (1999) and Hollander, Wolfe & Chicken (2014). For formal research, verify results in R (binom.test or BSDA::SIGN.test) or Python (scipy.stats.binomtest). Cite the tool as: STATS UNLOCK. (2025). Sign test calculator. Retrieved from https://statsunlock.com/sign-test-calculator.
What should I do if my result is non-significant — does that mean my hypothesis is wrong?
A non-significant result (p > α) does not prove H₀ is true — it only means the data are insufficient to reject it. With small samples the sign test has low power, so non-significance may simply reflect insufficient data (Type II error). Inspect p̂ and the Wilson CI before concluding "no effect". If feasible, increase n or use a more powerful test such as the Wilcoxon signed-rank test when symmetry holds.
📚 References
The following references support the statistical methods used in this sign test calculator, covering non-parametric hypothesis testing, p-value interpretation, and best practices in effect size reporting for median-based inference.
- Arbuthnott, J. (1710). An argument for divine providence, taken from the constant regularity observed in the births of both sexes. Philosophical Transactions of the Royal Society of London, 27(328), 186–190. https://doi.org/10.1098/rstl.1710.0011
- Conover, W. J. (1999). Practical nonparametric statistics (3rd ed.). John Wiley & Sons.
- Hollander, M., Wolfe, D. A., & Chicken, E. (2014). Nonparametric statistical methods (3rd ed.). John Wiley & Sons. https://doi.org/10.1002/9781119196037
- Siegel, S., & Castellan, N. J. (1988). Nonparametric statistics for the behavioral sciences (2nd ed.). McGraw-Hill.
- Sprent, P., & Smeeton, N. C. (2007). Applied nonparametric statistical methods (4th ed.). Chapman & Hall/CRC. https://doi.org/10.1201/9781420010923
- Cohen, J. (1988). Statistical power analysis for the behavioral sciences (2nd ed.). Lawrence Erlbaum Associates.
- Field, A. (2018). Discovering statistics using IBM SPSS statistics (5th ed.). SAGE Publications.
- Wilson, E. B. (1927). Probable inference, the law of succession, and statistical inference. Journal of the American Statistical Association, 22(158), 209–212. https://doi.org/10.1080/01621459.1927.10502953
- Lakens, D. (2013). Calculating and reporting effect sizes to facilitate cumulative science: A practical primer for t-tests and ANOVAs. Frontiers in Psychology, 4, 863. https://doi.org/10.3389/fpsyg.2013.00863
- Cumming, G. (2014). The new statistics: Why and how. Psychological Science, 25(1), 7–29. https://doi.org/10.1177/0956797613504966
- American Psychological Association. (2020). Publication manual of the American Psychological Association (7th ed.). APA. https://doi.org/10.1037/0000165-000
- Sawilowsky, S. S. (2009). New effect size rules of thumb. Journal of Modern Applied Statistical Methods, 8(2), 597–599. https://doi.org/10.22237/jmasm/1257035100
- R Core Team. (2024). R: A language and environment for statistical computing. R Foundation for Statistical Computing. https://www.R-project.org/
- NIST/SEMATECH. (2013). e-Handbook of statistical methods. National Institute of Standards and Technology. https://www.itl.nist.gov/div898/handbook/
- Virtanen, P., Gommers, R., Oliphant, T. E., et al. (2020). SciPy 1.0: Fundamental algorithms for scientific computing in Python. Nature Methods, 17, 261–272. https://doi.org/10.1038/s41592-020-0772-5


