Kendall's Tau Calculator
A free online Kendall's Tau calculator for the non-parametric rank-correlation test. Compute Tau-a, Tau-b, Tau-c, z-score, p-value, 95% confidence interval, and full APA-format results — with publication-quality charts and a step-by-step interpretation guide.
📑 Quick Navigation
01 Data Input
| X (Variable 1) | Y (Variable 2) |
|---|
02 Test Configuration
07 Formulas & Technical Notes
Mathematical Formulas — Tau-a, Tau-b, Tau-c
Tau-a (no tie correction)
Tau-b (tie-corrected, square tables)
Tau-c (rectangular tables)
Standard error and z-statistic
Assumptions and Recommendations
1. Paired observations. Each X must have a matching Y from the same subject.
2. Ordinal or continuous data. Both variables must be at least ordinal.
3. Independence. Pairs must be independent of one another.
4. Monotonic relationship. Tau detects monotonic — not necessarily linear — relationships.
5. Ties. Use Tau-b when ties are present in either variable; Tau-c for rectangular contingency tables.
Alternatives. If the relationship is linear and data are normal, prefer Pearson's r. If monotonic but with no ties and a moderate sample, Spearman's rho is also valid.
08 When to Use Kendall's Tau
This free Kendall's Tau calculator is designed for researchers, students, and analysts who need a robust rank-correlation method that handles ordinal data, tied ranks, and small samples without assuming normality or linearity.
✅ Decision Checklist
- Both variables are ordinal, continuous, or rankable
- You expect a monotonic (but possibly non-linear) relationship
- Paired observations come from the same units
- Sample size is small (n < 30) or many tied ranks are present
- Data are non-normally distributed
- Do NOT use if the relationship is non-monotonic (e.g. U-shaped) — use a non-linear method
- Do NOT use if data are categorical and unordered — use Cramér's V
- Do NOT use if observations are not paired — use a rank-sum / Mann-Whitney test
🌍 Real-World Examples
- Medical research — relationship between drug dosage rank and pain reduction rank in a small clinical pilot.
- Education — association between class rank and standardized test rank for 18 students.
- Psychology — agreement between two judges' rankings of essays (inter-rater concordance).
- Ecology & wildlife — ordinal habitat-quality score vs species-richness score across plots.
- Business & marketing — customer satisfaction rank vs repeat-purchase rank with many tied scores.
📏 Sample Size Guidance
Kendall's Tau is reliable from n ≥ 8 and gives stable inference at n ≥ 20. For 80% power to detect a medium effect (τ = 0.30) at α = 0.05 (two-tailed), you need approximately 65 paired observations; for a small effect (τ = 0.10) you need ≈ 600.
🌳 Decision Tree
09 How to Use This Kendall's Tau Calculator
Step 1 — Enter Your Data
Choose one of three input methods:
• Paste / Type — comma-separated values, e.g. 52, 48, 55, 61, 47, 50, 58. Both groups must have the same number of values.
• Upload CSV / Excel — point the X and Y selectors at the relevant numeric columns.
• Manual Entry — type each pair into the table.
Step 2 — Choose a Sample Dataset (optional)
Pick from five built-in datasets to see the tool work end-to-end before pasting your own data. Dataset 1 (Study Hours vs Exam Score) is loaded by default.
Step 3 — Configure Test Settings
α (alpha): 0.05 is the default. Use 0.01 for stricter Type I control.
Tail type: Two-tailed unless you have a directional hypothesis pre-registered.
Tau variant: Auto recommends Tau-b. Pick Tau-c only for rectangular contingency tables.
Step 4 — Click "Calculate Kendall's Tau"
Press the green button. Results appear in under a second for samples up to 5,000.
Step 5 — Read the Summary Cards
Five colourful cards show τ, z, p, n, and 95% CI. Card colours flag significance (green = significant; amber = borderline; red = non-significant).
Step 6 — Read the Full Results Table
Every statistic is listed with a description. Confidence intervals follow Fieller's transformation.
Step 7 — Examine the Four Visualizations
Scatter plot, concordant/discordant breakdown, rank-rank plot, and z-distribution with critical region.
Step 8 — Check Assumptions
Each badge tells you whether the assumption passes (green), warns (amber), or fails (red).
Step 9 — Read the Interpretation
Five plain-language paragraphs explain the result, p-value, effect size, practical importance, and limitations.
Step 10 — Export Your Results
Download a plain-text report (.txt) or a print-ready PDF for your manuscript appendix.
10 Frequently Asked Questions
Q1. What is Kendall's Tau and when should I use it?
Kendall's Tau is a non-parametric measure of the strength and direction of the monotonic association between two ordinal or continuous variables. It is based on the count of concordant and discordant pairs. Use it when your data are ordinal, contain many tied ranks, are non-normally distributed, or your sample is small (n < 30).
Q2. What is the difference between Kendall's Tau and Spearman's rho?
Both are non-parametric monotonic-correlation measures. Tau uses pair-counting (concordant minus discordant), so its value has a direct probabilistic interpretation: τ = P(concordant) − P(discordant). Spearman's rho is Pearson's r applied to ranks. Tau is more robust with small samples and many ties; Spearman is more sensitive to outliers in the ranks. Tau values are usually smaller in magnitude than rho on the same data.
Q3. What does the p-value mean for Kendall's Tau?
The p-value is the probability of observing a |τ| as large as the one you computed if the population τ were truly zero. A p-value of 0.03 means there is a 3% chance of seeing this much (or more) association by chance under the null hypothesis of no monotonic relationship. It is not the probability that the null hypothesis is true.
Q4. How do I interpret the Kendall's Tau effect size?
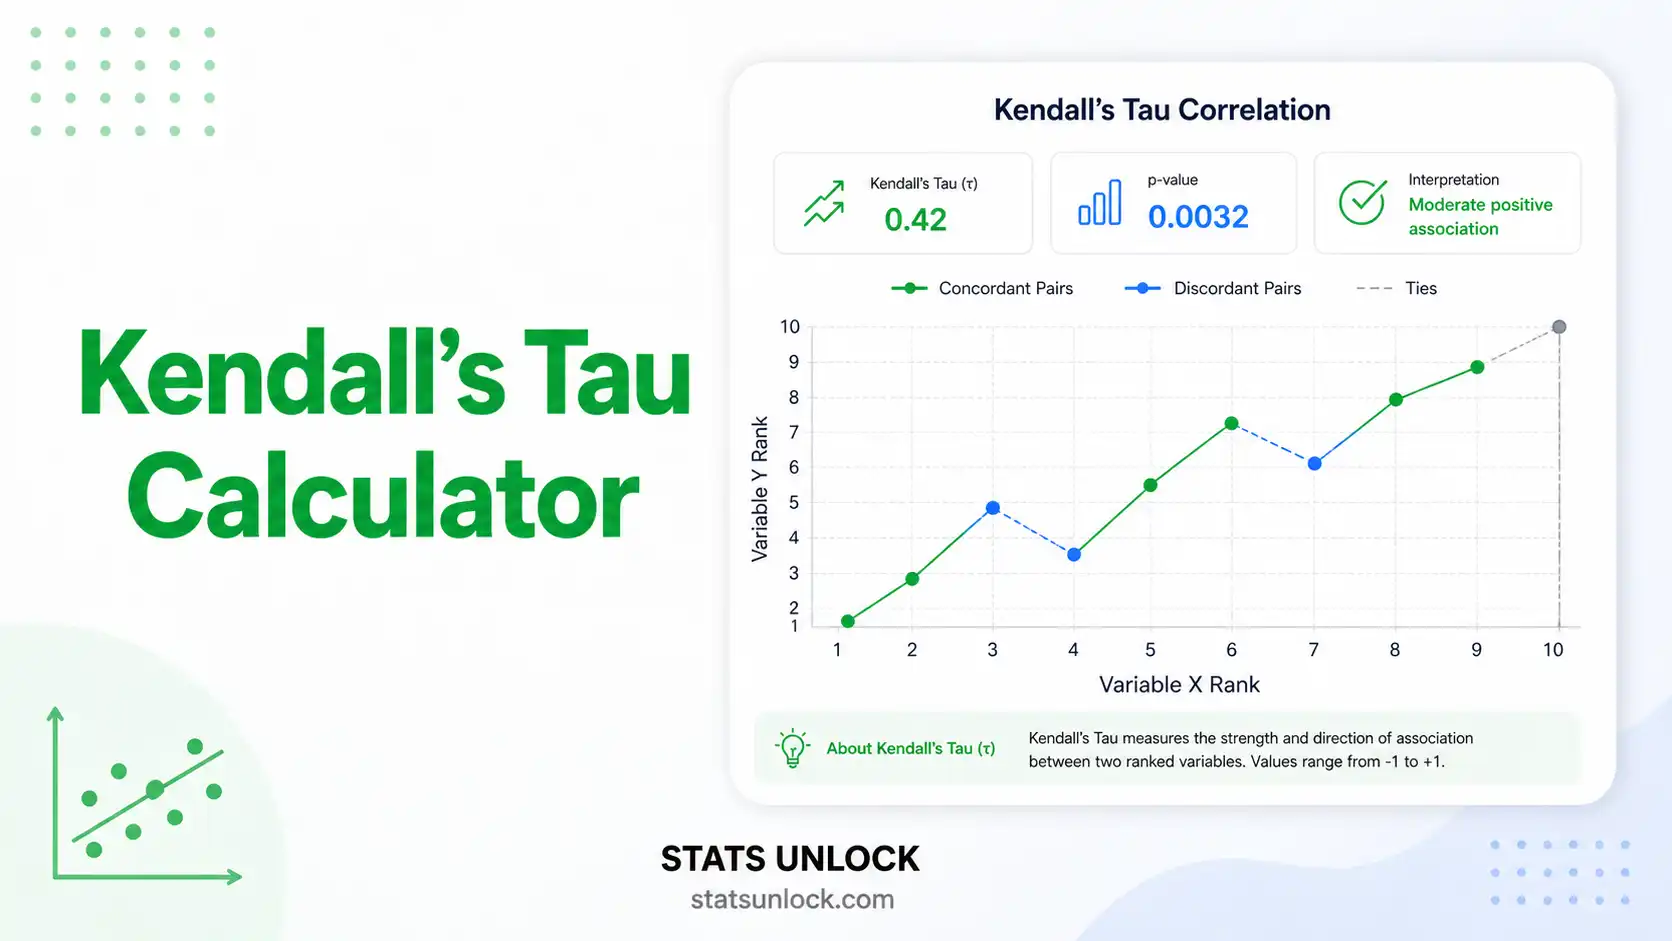
Tau ranges from −1 to +1. Common benchmarks: |τ| ≈ 0.10 small, 0.30 medium, 0.50 large. A value of τ = 0.42 means roughly that, of all possible pairs, 71% are concordant and 29% are discordant — a clearly positive monotonic relationship.
Q5. What is the difference between Tau-a, Tau-b, and Tau-c?
Tau-a ignores ties — appropriate only when ranks are unique. Tau-b corrects for ties and is the default for square contingency tables or paired ordinal data with ties. Tau-c (or Stuart's tau-c) is used for rectangular contingency tables where the two variables have a different number of categories.
Q6. What assumptions does Kendall's Tau require?
(1) Both variables are at least ordinal. (2) Paired observations are independent across pairs. (3) The relationship is monotonic (consistently increasing or decreasing). Kendall's Tau does not assume normality, linearity, or homoscedasticity.
Q7. How large a sample do I need for Kendall's Tau?
The exact distribution is defined from n = 4. For 80% power at α = 0.05 (two-tailed): small effect (τ = 0.10) needs n ≈ 600; medium effect (τ = 0.30) needs n ≈ 65; large effect (τ = 0.50) needs n ≈ 22. For very small n (< 10), use the exact permutation p-value rather than the normal approximation.
Q8. How do I report Kendall's Tau in APA 7th edition format?
Report as: "Kendall's tau-b revealed a significant positive association between study hours and exam score, τb(N = 25) = .42, p = .003, 95% CI [.18, .62]." Always include n, exact p (or p < .001), and a CI when possible.
Q9. Can I use this calculator for my published research or thesis?
This tool is suitable for educational use, exploratory analysis, and verification. For peer-review submission, also verify in R (cor.test(x, y, method = "kendall")), SPSS (Bivariate Correlations → Kendall's tau-b), or Python (scipy.stats.kendalltau). Cite as: "STATS UNLOCK. (2026). Kendall's Tau calculator. https://statsunlock.com".
Q10. What if my Kendall's Tau result is non-significant?
A non-significant p (> α) means the data do not provide sufficient evidence of a monotonic association — it does not prove no association exists. Possible reasons: low power (small n), small true effect, or genuine absence of monotonic association. Run a sensitivity / power analysis and inspect the scatter plot for non-monotonic shapes that Tau cannot detect.
11 References
The following references support the statistical methods used in this Kendall's Tau calculator, covering p-value interpretation, effect size, and best practices in hypothesis testing with rank-correlation methods.
- Kendall, M. G. (1938). A new measure of rank correlation. Biometrika, 30(1–2), 81–93. https://doi.org/10.1093/biomet/30.1-2.81
- Kendall, M. G. (1948). Rank correlation methods. Charles Griffin & Co.
- Kendall, M. G., & Gibbons, J. D. (1990). Rank correlation methods (5th ed.). Edward Arnold.
- Stuart, A. (1953). The estimation and comparison of strengths of association in contingency tables. Biometrika, 40(1–2), 105–110. https://doi.org/10.1093/biomet/40.1-2.105
- Cohen, J. (1988). Statistical power analysis for the behavioral sciences (2nd ed.). Lawrence Erlbaum Associates.
- Field, A. (2018). Discovering statistics using IBM SPSS statistics (5th ed.). SAGE.
- Hollander, M., Wolfe, D. A., & Chicken, E. (2014). Nonparametric statistical methods (3rd ed.). Wiley.
- Newson, R. (2002). Parameters behind "nonparametric" statistics: Kendall's tau, Somers' D and median differences. Stata Journal, 2(1), 45–64. https://doi.org/10.1177/1536867X0200200103
- Croux, C., & Dehon, C. (2010). Influence functions of the Spearman and Kendall correlation measures. Statistical Methods & Applications, 19(4), 497–515. https://doi.org/10.1007/s10260-010-0142-z
- Bonett, D. G., & Wright, T. A. (2000). Sample size requirements for estimating Pearson, Kendall and Spearman correlations. Psychometrika, 65(1), 23–28. https://doi.org/10.1007/BF02294183
- American Psychological Association. (2020). Publication manual of the American Psychological Association (7th ed.). APA. https://doi.org/10.1037/0000165-000
- Lakens, D. (2013). Calculating and reporting effect sizes to facilitate cumulative science: A practical primer for t-tests and ANOVAs. Frontiers in Psychology, 4, 863. https://doi.org/10.3389/fpsyg.2013.00863
- R Core Team. (2024). R: A language and environment for statistical computing. R Foundation for Statistical Computing. https://www.R-project.org/
- Virtanen, P., Gommers, R., Oliphant, T. E., et al. (2020). SciPy 1.0: Fundamental algorithms for scientific computing in Python. Nature Methods, 17, 261–272. https://doi.org/10.1038/s41592-020-0772-5
- NIST/SEMATECH. (2013). e-Handbook of statistical methods. National Institute of Standards and Technology. https://www.itl.nist.gov/div898/handbook/


