Chi-Square Goodness-of-Fit Test Calculator
Test whether your observed frequencies match expected frequencies — free online tool with step-by-step results, effect size, APA write-up, and 4 interactive charts.
Step 1 — Enter Your Data
Enter Observed (O) and Expected (E) counts for each category. Click + Add Category to add more rows. Category names are editable.
💡 Tip: For comma-separated quick entry, paste values in the Observed field. Or click a sample dataset above.
Enter values directly into the table cells below. Click + Add Row to add more categories.
| # | Category Name | Observed (O) | Expected (E) |
|---|
Step 2 — Configuration
Results Summary
Visualizations
Assumption Checks
Detailed Interpretation of Results
How to Write Your Results in Research
Technical Notes — Formulas Used
View Formulas
When to Use the Chi-Square Goodness-of-Fit Test
Use the chi-square goodness-of-fit test when you want to check whether the distribution of a single categorical variable matches a theoretically expected distribution.
✅ Good fit for this test
- One categorical variable with 2+ categories
- Data are counts (not proportions or means)
- Each observation falls in exactly one category
- All expected frequencies ≥ 5
- You have a theoretical expected distribution
❌ Consider alternatives if…
- Expected frequencies < 5 → use Fisher's Exact Test
- Testing association between two variables → use Chi-Square Test of Independence
- Data are continuous → use KS test or Anderson-Darling
- Paired or repeated measurements → use McNemar's test
🔬 Common applications
- Testing if a die is fair (equal frequencies)
- Hardy-Weinberg equilibrium in genetics
- Species habitat use vs. habitat availability
- Market share vs. expected proportions
- Survey response distribution checks
📐 Decision tree
- Categorical? → Yes
- One variable? → Yes → Goodness-of-Fit
- Two variables? → Yes → Test of Independence
- Expected counts all ≥ 5? → Yes → χ² GoF
- Small counts → Fisher's / Exact Test
How to Use This Calculator — 10-Step Guide
Choose or enter your data
Enter observed counts for each category in the Type/Paste tab, upload a CSV/Excel file, or fill the manual table. Each row is one category (e.g., colour, day, habitat type).
Enter expected frequencies
For each category, enter the expected count. If you expect equal distribution, click Set Equal Expected to auto-fill proportional counts. Or enter custom values based on theory.
Name your categories
Click the category name field (e.g., "Category 1") and type a meaningful label such as "Red", "Monday", or "Dense Forest". This makes results easier to read.
Add or remove categories
Click + Add Category to add more rows. Click the ✕ button on any row to remove it. You need at least 2 categories.
Set significance level
Choose α = 0.05 (most common), 0.01 (strict), or 0.10 (exploratory). You can also enter a custom value. Your choice affects the critical value and the significance decision.
Run the test
Click Run Chi-Square Goodness-of-Fit Test. The tool checks assumptions, calculates χ², df, p-value, Cohen's w, and Cramér's V instantly.
Read the summary cards
Six summary cards show the most important values at a glance: χ², df, p-value, Cohen's w, sample size N, and the significance decision. Green = significant, amber = borderline.
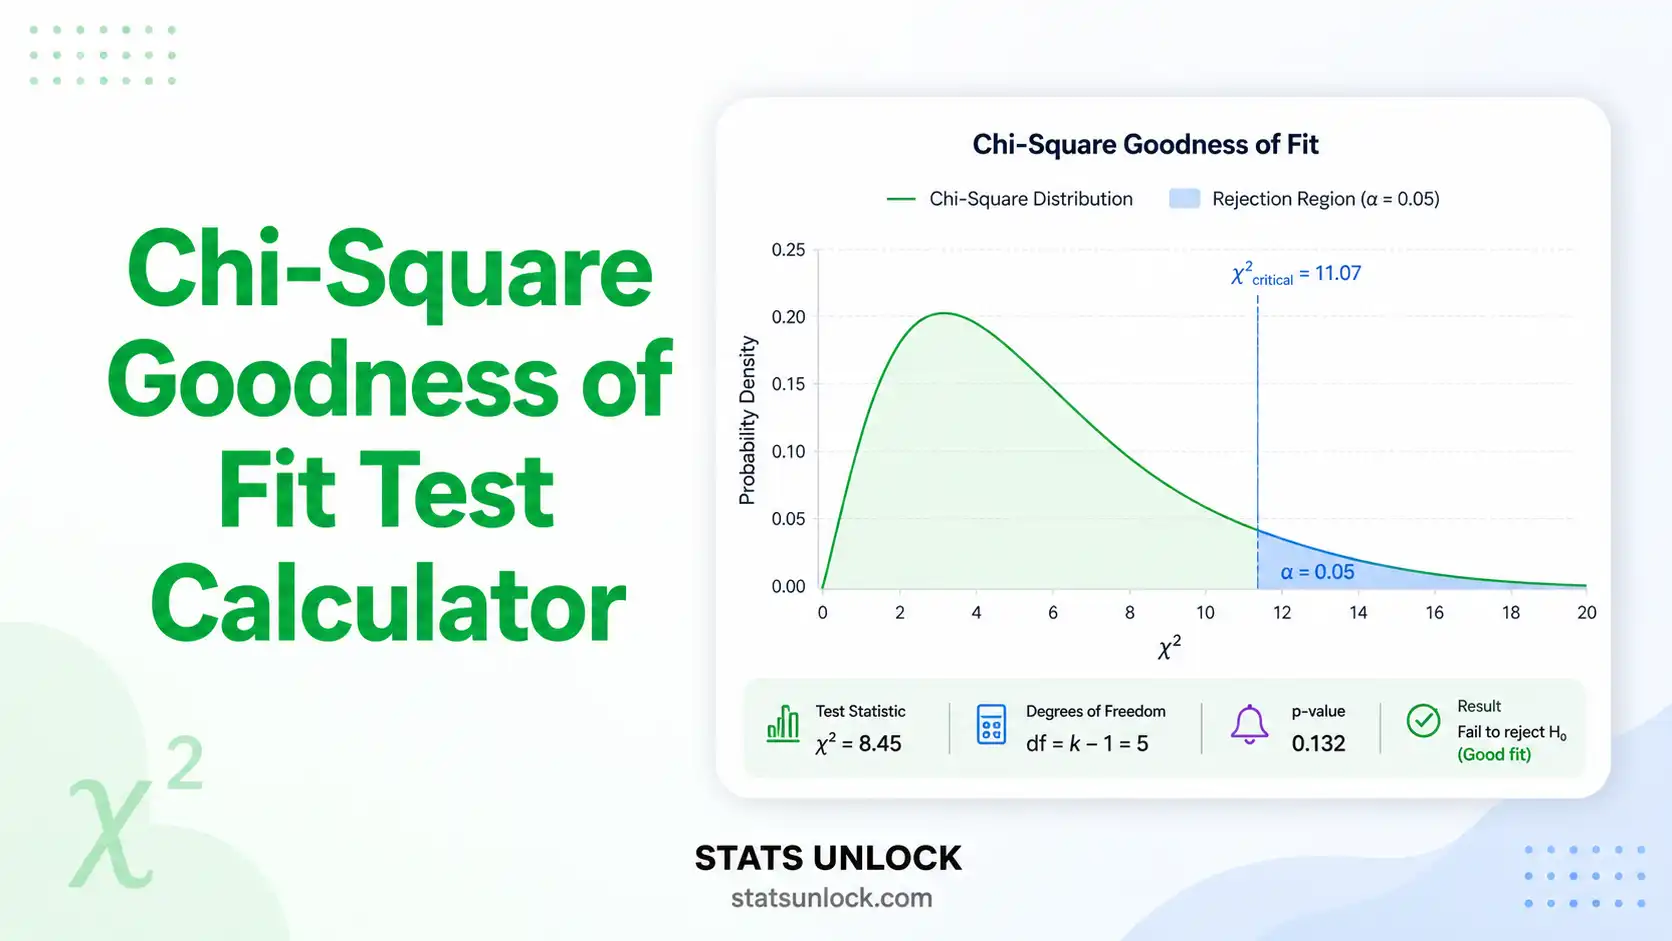
Interpret the charts
Chart 1 compares observed vs expected bars. Chart 2 shows which category contributes most to χ². Chart 3 shows where your statistic falls on the χ² distribution. Chart 4 shows O−E deviations.
Read the interpretation and write-up
Scroll to the Detailed Interpretation section. It explains the result in plain language. Then choose from five auto-filled write-up templates (APA 7th, thesis, plain language, abstract, pre-registration).
Download your report
Click Download Report (.txt) for a plain-text results file, or Download PDF to print or save as PDF directly from your browser.
Frequently Asked Questions
What is the chi-square goodness-of-fit test?
What is the difference between goodness-of-fit and test of independence?
What are the assumptions of the chi-square goodness-of-fit test?
How do I interpret a chi-square goodness-of-fit p-value?
What effect size should I report with this test?
What happens if my expected frequencies are less than 5?
How do I write chi-square goodness-of-fit results in APA format?
Is the chi-square goodness-of-fit test one-tailed or two-tailed?
Can I use this test for continuous data?
How do I use this test in ecology or biology?
What is the null hypothesis for this test?
How many categories do I need?
References
The chi-square goodness-of-fit test calculator on StatsUnlock is built on peer-reviewed methodology from statistics, ecology, and quantitative research. The following references support the goodness-of-fit test formulas, effect size calculations, and interpretation standards used in this tool.
- Pearson, K. (1900). On the criterion that a given system of deviations from the probable in the case of a correlated system of variables is such that it can be reasonably supposed to have arisen from random sampling. Philosophical Magazine, 50(302), 157–175. https://doi.org/10.1080/14786440009463897
- Cohen, J. (1988). Statistical power analysis for the behavioral sciences (2nd ed.). Lawrence Erlbaum Associates.
- Cochran, W. G. (1952). The χ² test of goodness of fit. The Annals of Mathematical Statistics, 23(3), 315–345. https://doi.org/10.1214/aoms/1177729380
- Agresti, A. (2013). Categorical data analysis (3rd ed.). Wiley.
- Conover, W. J. (1999). Practical nonparametric statistics (3rd ed.). Wiley.
- Cramér, H. (1946). Mathematical methods of statistics. Princeton University Press.
- Field, A. (2018). Discovering statistics using IBM SPSS statistics (5th ed.). Sage Publications.
- Tabachnick, B. G., & Fidell, L. S. (2019). Using multivariate statistics (7th ed.). Pearson.
- Zar, J. H. (2010). Biostatistical analysis (5th ed.). Prentice Hall. [Standard ecology statistics reference including chi-square goodness-of-fit for habitat use]
- Siegel, S., & Castellan, N. J. (1988). Nonparametric statistics for the behavioral sciences (2nd ed.). McGraw-Hill.
- Goodman, L. A. (1954). Kolmogorov-Smirnov tests for psychological research. Psychological Bulletin, 51(2), 160–168. https://doi.org/10.1037/h0054447
- Sokal, R. R., & Rohlf, F. J. (2012). Biometry: The principles and practice of statistics in biological research (4th ed.). W.H. Freeman.
- McDonald, J. H. (2014). Handbook of biological statistics (3rd ed.). Sparky House Publishing. http://www.biostathandbook.com/chigof.html
- Mangiafico, S. S. (2016). Summary and analysis of extension program evaluation in R, version 1.18.1. Rutgers Cooperative Extension. https://rcompanion.org/handbook/
- American Psychological Association. (2020). Publication manual of the American Psychological Association (7th ed.). APA. https://doi.org/10.1037/0000165-000


