


📊 Parametric · Hypothesis Test
ANCOVA Calculator
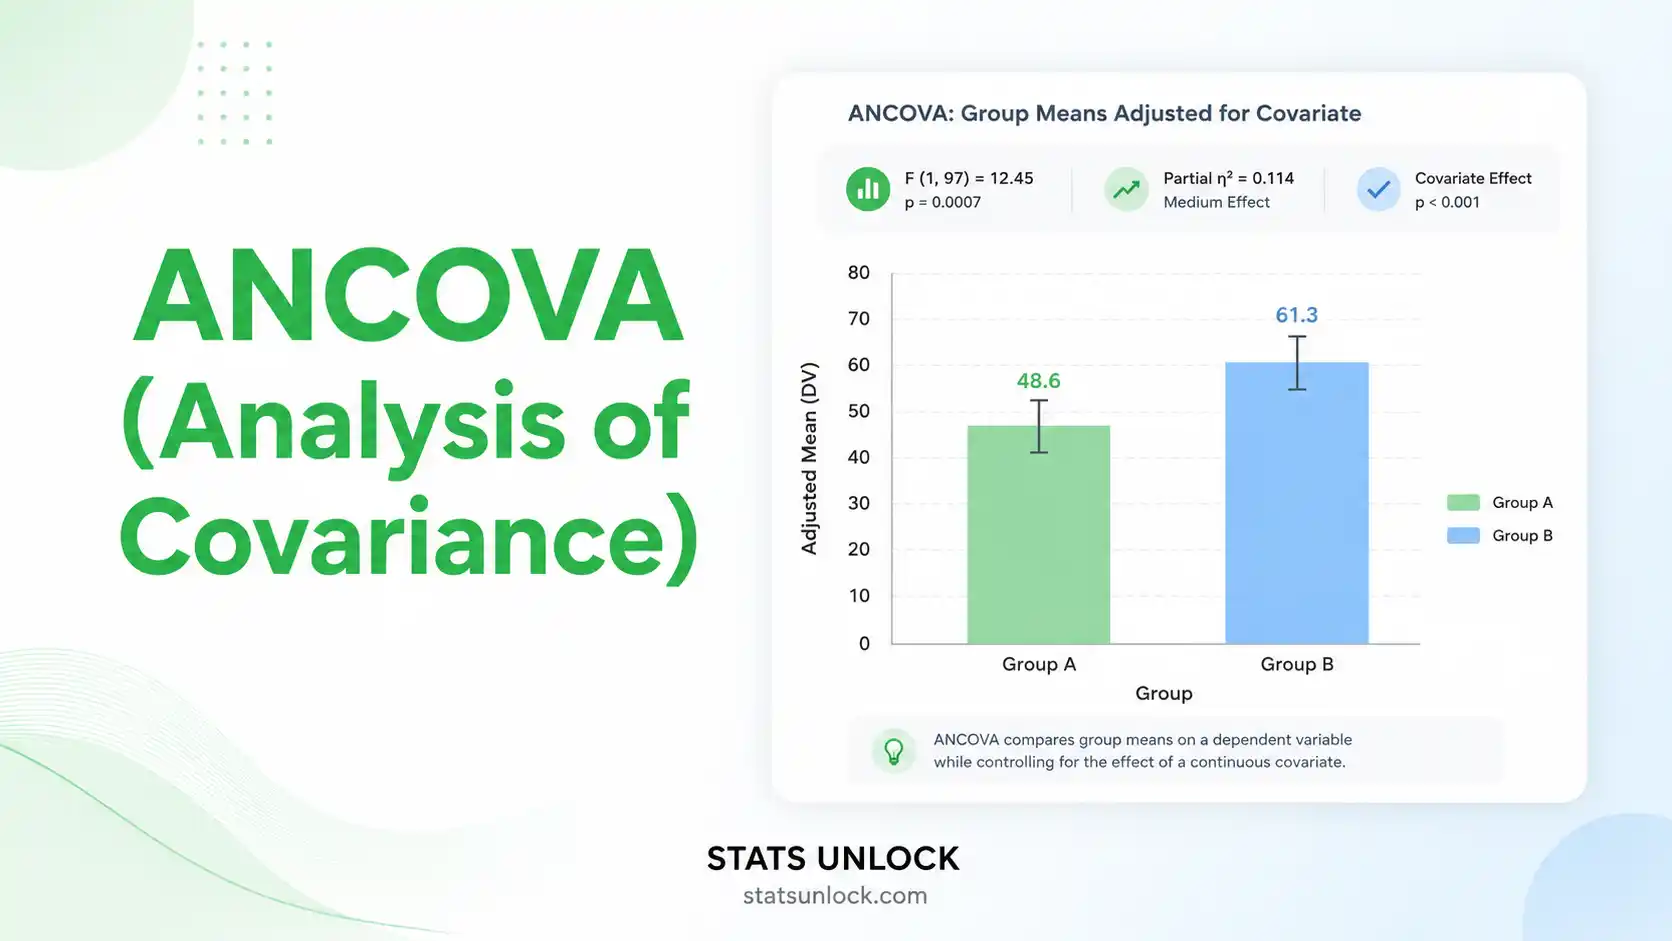
Analysis of Covariance — compare group means on a continuous outcome while statistically controlling for one or more covariates. Get adjusted means, F-statistic, p-value, partial η², four visualizations, and APA-ready results.
📥 Data Input
Edit to match your continuous covariate.
Outcome (Y) and Covariate (X) per group
Enter outcome and covariate values as comma-separated numbers. The same position in both rows = the same participant. Group names are editable.
Supports .csv, .txt, .xlsx, .xls — headers detected automatically.
Manual entry: edit the textareas above in the Paste/Type tab. Each row is one participant. For most use cases the Type tab is the fastest entry path.