ARMA Model Calculator
Fit an ARMA(p,q) model online — get coefficients, AIC/BIC, residual diagnostics, ACF/PACF, an h-step forecast, and a publication-ready APA paragraph from your time series in seconds.
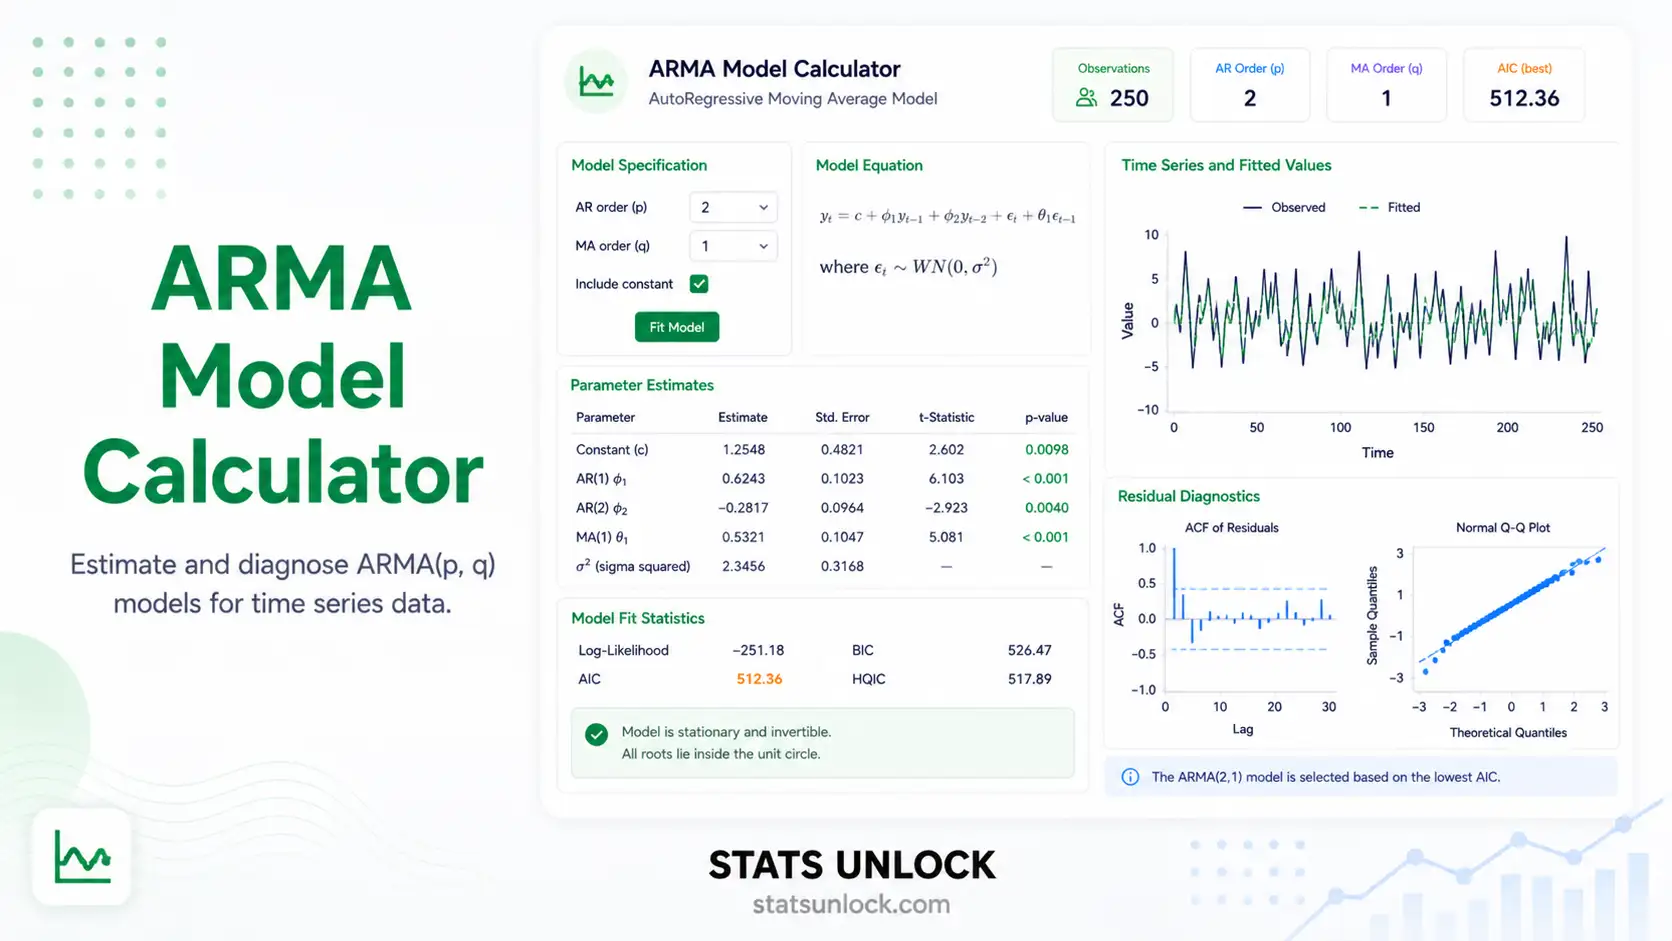
📥 Step 1 — Enter Your Time Series
Provide a stationary or near-stationary time series. You can paste comma-separated values, upload a CSV/Excel file, or use a built-in sample dataset.
⚙️ Step 2 — Configure ARMA(p,q)
Set autoregressive order p, moving average order q, significance level α, and forecast horizon. Auto-select uses BIC search over (p,q) ∈ {0..3}.
🧮 Technical Notes & Formulas
📐 Sub-section A — Formulas Used
ARMA(p,q) — General form
- y_t = value of the series at time t
- c = constant (related to the unconditional mean μ via c = μ·(1 − Σφᵢ))
- φ₁…φ_p = autoregressive (AR) coefficients
- θ₁…θ_q = moving-average (MA) coefficients
- ε_t = white-noise innovation, ε_t ~ N(0, σ²)
- p, q = AR and MA orders, both non-negative integers
Sample autocorrelation (ACF) at lag k
95% confidence band for residual ACF
Information criteria
- k = number of estimated parameters = p + q + (1 if mean fitted) + 1 (σ²)
- n = number of observations
- log L = maximized log-likelihood (Gaussian innovations)
Ljung–Box Q-statistic on residuals
h-step forecast (after fitting)
95% forecast interval
where ψ_j are the impulse-response weights from the MA(∞) representation.
📝 Sub-section B — Technical Notes
Assumptions of ARMA(p,q)
- Stationarity — the mean, variance and autocovariance of y_t do not depend on t. Test with the Augmented Dickey–Fuller (ADF) and KPSS tests; if rejected, difference the series and consider ARIMA instead.
- Invertibility — for the MA part, the roots of the MA polynomial 1 + θ₁z + … + θ_q z^q must lie outside the unit circle.
- White-noise innovations — ε_t are uncorrelated, mean zero, constant variance, and (for likelihood-based inference) approximately Gaussian.
- Linearity — y_t is a linear function of past values and past shocks. Non-linear or regime-switching dynamics need different models (TAR, Markov-switching, GARCH).
- Sufficient sample — at least 50 observations; 100+ recommended for higher orders.
Recommended follow-ups
- If the Ljung–Box test on residuals is significant, increase p or q, or refit as ARIMA / SARIMA.
- If volatility clusters appear in the residual squared series, consider a GARCH layer.
- For seasonal patterns, switch to SARIMA(p,d,q)(P,D,Q)_s.
- For multivariate time series, use VAR or VECM rather than univariate ARMA.
📚 How to Write ARMA Results in a Paper
APA 7th Edition Template
An ARMA(p, q) model was fitted to the [series name] series (n = ___). Order
selection by [BIC / AIC] yielded ARMA(__, __). The fitted coefficients were
φ̂₁ = ___ (SE = ___), …, θ̂₁ = ___ (SE = ___). The model produced
AIC = ___, BIC = ___, and residual variance σ̂² = ___. Residual diagnostics
(Ljung–Box Q(10) = ___, p = ___) were [consistent with / inconsistent with]
white noise, suggesting the model is [adequate / requires revision].
Methods Section Template
Univariate time-series modelling followed the Box–Jenkins methodology. Stationarity was assessed with the Augmented Dickey–Fuller test. Candidate ARMA(p, q) models with p, q ∈ {0, 1, 2, 3} were estimated by conditional maximum likelihood, and the final order was selected by minimum BIC. Adequacy was confirmed by inspecting the ACF and PACF of residuals and the Ljung–Box Q-statistic at lag 10.
Reporting Rules
- Always report (p, q) explicitly — never just "ARMA model".
- Quote AIC and BIC; readers from different traditions will look for one or the other.
- Report Ljung–Box Q(m), df, and p-value as a residual-adequacy check.
- State whether a constant / mean term was included in the fit.
- Express forecasts with their 95% prediction intervals — never the point forecast alone.
🎯 When to Use the ARMA Model
The free ARMA model calculator on this page is appropriate when you want to model a univariate, stationary time series whose dependence on its own past can be captured by a finite number of AR and MA terms. It answers the question: what linear, parsimonious process best describes the autocorrelation in my data?
Decision Checklist
- Your series is stationary (or near-stationary after de-trending) — confirmed by ADF / KPSS
- There is no obvious seasonality at a fixed period
- You have at least 50 observations (100+ ideal)
- The relationship between y_t and its lags looks linear
- Do NOT use if the series has a strong unit root → difference and use ARIMA
- Do NOT use if you see periodic peaks at lag 12, 24, 7, etc. → use SARIMA
- Do NOT use if you have multiple interacting series → use VAR
- Do NOT use if variance changes over time (volatility clusters) → use GARCH
Real-World Examples
- Finance — daily log-returns. Equity log-returns are typically near-stationary with weak autocorrelation; an ARMA(1,1) often captures the short-run dependence and is a baseline before adding GARCH.
- Hydrology — daily river-flow residuals. After removing seasonality, the residual flow series often follows a low-order ARMA, used for short-term flood forecasting.
- Psychology — reaction-time deviations. Trial-by-trial residuals from a baseline model frequently exhibit AR(1) structure that ARMA can model and remove.
- Ecology — nightly camera-trap detections. Detection counts at a single station after removing weekly periodicity often follow a stationary ARMA process useful for activity-pattern modelling.
- Quality control — process measurements. Manufacturing measurements at a stable line are often modelled as ARMA to detect drift outside control limits.
Sample Size Guidance
Minimum n ≥ 50 for ARMA(1,1); aim for n ≥ 100 when (p + q) ≥ 3. Small n inflates SEs and makes order selection unstable.
❓ Frequently Asked Questions
Q1. What is an ARMA model and when should I use it?
An ARMA(p, q) model describes a stationary time series as a linear combination of its own past p values (the AR part) and the past q random shocks (the MA part). Use it whenever your series is stationary, has no clear seasonality, and shows non-zero autocorrelation that you want to capture in a parsimonious model — for example, monthly stock returns or detrended sensor data.
Q2. What is the difference between AR, MA, ARMA and ARIMA?
AR(p) models y_t from its own past values; MA(q) models it from past shocks; ARMA(p, q) combines the two for a stationary series; ARIMA(p, d, q) first differences the series d times to make it stationary, then fits ARMA. Use ARMA when the original series is already stationary; otherwise use ARIMA.
Q3. How do I choose the orders p and q?
Three complementary tools: (1) inspect the ACF — it cuts off at lag q for a pure MA(q); (2) inspect the PACF — it cuts off at lag p for a pure AR(p); (3) compare candidate models by AIC or BIC and pick the minimum. This calculator does the AIC/BIC search automatically when you set "Order selection" to Auto.
Q4. What do AIC and BIC mean and which should I trust?
AIC and BIC are model selection criteria — both reward fit and penalize complexity, and lower is better. BIC penalizes extra parameters more heavily and tends to pick simpler models in large samples. Many forecasters use BIC as the primary criterion and AIC as a sanity check. If they disagree, prefer the simpler model.
Q5. What assumptions does ARMA make and what if mine fail?
ARMA assumes stationarity, invertibility of the MA part, and white-noise Gaussian innovations. If stationarity fails, difference the series (move to ARIMA) or de-trend. If residuals are heteroscedastic, layer a GARCH model on top. If they are heavy-tailed, switch to a robust likelihood (Student-t innovations).
Q6. How large a sample do I need for an ARMA fit to be trustworthy?
A practical minimum is n = 50; n ≥ 100 is preferred when p + q ≥ 3. With fewer than 30 observations, parameter estimates are dominated by sampling noise and any single-model conclusion is unreliable.
Q7. What is the Ljung–Box test and how do I interpret it?
The Ljung–Box Q-statistic tests the joint null hypothesis that the first m residual autocorrelations are zero. A non-significant p-value (e.g., p > .05) means the residuals look like white noise and the model is adequate. A significant p-value means autocorrelation remains — try a higher (p, q) or move to ARIMA / SARIMA.
Q8. How do I report ARMA results in APA 7th edition format?
Report (p, q), the estimated coefficients with standard errors, AIC, BIC, residual variance σ̂², and a Ljung–Box adequacy line. Section 5 of this calculator generates a copy-ready APA paragraph automatically using your fitted values.
Q9. Can I use this calculator for my published research?
This tool is designed for teaching, exploratory analysis, and homework. For final published research, replicate the fit in R (forecast / fable packages) or Python (statsmodels) and report the software version. Cite this tool as: STATS UNLOCK. (2026). ARMA model calculator. https://statsunlock.com.
Q10. What if my forecast intervals are very wide?
Wide intervals are honest — they reflect genuine uncertainty given limited information. They widen with the forecast horizon, with high residual variance, and with persistent AR coefficients close to 1. To narrow them, gather more data, find better predictors (move to ARIMAX), or shorten the horizon you actually need.
📘 How to Use This Tool — 10 Steps
- Enter your data — paste comma-separated values, upload a CSV/Excel, or use a sample dataset.
- Pick a sample dataset — five built-in series cover finance, hydrology, psychology, economics, and ecology.
- Edit the group name — the label appears in charts and the APA paragraph.
- Set p and q — start with (1, 1) if unsure, or choose Auto-BIC to let the tool search (p, q) ∈ {0..3}.
- Set α and forecast horizon — α governs prediction-interval coverage; horizon h sets how far ahead to forecast.
- Run the analysis — click "Fit ARMA Model"; results render in under 1 second.
- Read the summary cards — p, q, AIC, BIC, σ̂², and Ljung–Box at a glance.
- Inspect the four charts — series + forecast, residual ACF, residual PACF, and residual scatter.
- Read the detailed interpretation and conclusion — these auto-fill with your numbers.
- Export — Download Doc (.txt) or Download PDF (print-to-PDF) for your report.
📚 References
The following references support the statistical methods used in this ARMA model calculator, covering autoregressive moving average modelling, time series forecasting, and best practices in residual diagnostics and model selection.
- Box, G. E. P., Jenkins, G. M., Reinsel, G. C., & Ljung, G. M. (2015). Time Series Analysis: Forecasting and Control (5th ed.). Wiley. Publisher link
- Hamilton, J. D. (1994). Time Series Analysis. Princeton University Press. press.princeton.edu
- Brockwell, P. J., & Davis, R. A. (2016). Introduction to Time Series and Forecasting (3rd ed.). Springer. https://doi.org/10.1007/978-3-319-29854-2
- Hyndman, R. J., & Athanasopoulos, G. (2021). Forecasting: Principles and Practice (3rd ed.). OTexts. https://otexts.com/fpp3/
- Ljung, G. M., & Box, G. E. P. (1978). On a measure of lack of fit in time series models. Biometrika, 65(2), 297–303. https://doi.org/10.1093/biomet/65.2.297
- Akaike, H. (1974). A new look at the statistical model identification. IEEE Transactions on Automatic Control, 19(6), 716–723. https://doi.org/10.1109/TAC.1974.1100705
- Schwarz, G. (1978). Estimating the dimension of a model. Annals of Statistics, 6(2), 461–464. https://doi.org/10.1214/aos/1176344136
- Said, S. E., & Dickey, D. A. (1984). Testing for unit roots in autoregressive-moving average models of unknown order. Biometrika, 71(3), 599–607. https://doi.org/10.1093/biomet/71.3.599
- Kwiatkowski, D., Phillips, P. C. B., Schmidt, P., & Shin, Y. (1992). Testing the null hypothesis of stationarity against the alternative of a unit root. Journal of Econometrics, 54(1–3), 159–178. https://doi.org/10.1016/0304-4076(92)90104-Y
- Burnham, K. P., & Anderson, D. R. (2002). Model Selection and Multimodel Inference: A Practical Information-Theoretic Approach (2nd ed.). Springer. https://doi.org/10.1007/b97636
- Hyndman, R. J., & Khandakar, Y. (2008). Automatic time series forecasting: The forecast package for R. Journal of Statistical Software, 27(3), 1–22. https://doi.org/10.18637/jss.v027.i03
- Shumway, R. H., & Stoffer, D. S. (2017). Time Series Analysis and Its Applications: With R Examples (4th ed.). Springer. https://doi.org/10.1007/978-3-319-52452-8
- Seabold, S., & Perktold, J. (2010). Statsmodels: Econometric and statistical modeling with Python. Proceedings of the 9th Python in Science Conference, 92–96. https://www.statsmodels.org/
- R Core Team. (2024). R: A language and environment for statistical computing. R Foundation for Statistical Computing. https://www.R-project.org/
- American Psychological Association. (2020). Publication Manual of the American Psychological Association (7th ed.). APA. https://doi.org/10.1037/0000165-000


