F-Test for Variance Equality
Calculator
Free online F-test for variance equality calculator. Compare two-sample variances, get the F-statistic, p-value, confidence intervals, APA-format results, and publication-ready charts in one click.
📥Data Input
Enter values one per row in each cell. Use this for quick entry of small datasets.
⚙️Test Configuration
💡 Interpretation & How to Write Your Results
📝 Interpretation Results
▶ Run the F-test analysis above to generate a detailed plain-language interpretation of your variance comparison results.
✍️ How to Write Your Results in Research (5 Examples)
▶ Run the analysis above to auto-fill all five reporting templates with your computed F-statistic, degrees of freedom, p-value, and variance ratio.
📐 Technical Notes & Formulas
A. Formulas Used
F-Statistic (variance ratio):
Degrees of Freedom:
P-Value (two-tailed):
Confidence Interval for the Variance Ratio (σ₁²/σ₂²):
Effect Size — Variance Ratio:
B. Technical Notes
The F-test for variance equality (also called the F-test for equality of two variances or variance ratio test) is a parametric procedure that compares two independent sample variances by computing their ratio and referencing it against the F-distribution. The test is two-tailed by default because researchers typically have no prior reason to assume one specific group has the larger variance. Always interpret the F-test alongside a normality check (Shapiro-Wilk or Q-Q plot) — the test is highly sensitive to non-normality, and even small departures from normality can produce misleading p-values. If normality is questionable, prefer Levene's test or the Brown-Forsythe test, which are robust alternatives.
🎯 When to Use This Test
This free F-test for variance equality calculator is designed for researchers, students, quality engineers, and analysts who need to verify the equal-variance assumption before running parametric procedures such as the Student's t-test, one-way ANOVA, or general linear models. The F-test answers a single, focused research question: do two independent populations have equal variances?
✅ Decision Checklist
- You have two independent samples (no pairing or matching).
- Both variables are continuous (interval or ratio scale).
- Both samples are drawn from approximately normal distributions.
- Observations within each sample are independent of each other.
- Do NOT use if your data are non-normal — use Levene's test or Brown-Forsythe test instead.
- Do NOT use if you have 3+ groups — use Bartlett's test (normal data) or Levene's test (non-normal data).
- Do NOT use for paired/repeated-measures data — variance equality has no meaning for matched pairs.
🌍 Real-World Examples
1. Manufacturing Quality Control: Comparing the variability of part dimensions produced by two machines to determine which process is more consistent.
2. Pharmaceutical Research: Testing whether a new drug formulation produces more consistent blood-pressure responses than a placebo.
3. Educational Assessment: Comparing the spread of test scores under two different teaching methods to evaluate which approach produces more uniform learning outcomes.
4. Finance & Investment: Comparing the volatility (return variance) of two portfolios or mutual funds to assess relative risk.
5. Ecological Field Studies: Comparing the variability in body mass between two populations of the same species in different habitats.
📏 Sample Size Guidance
Minimum recommended n per group: 10 for normally distributed data, with 20–30 per group preferred for stable variance estimates. With small samples (n < 10), the F-test has very low statistical power. For high-stakes decisions, target n ≥ 30 per group.
🌳 Related Tests — Decision Tree
🚀 How to Use This F-Test for Variance Equality Calculator
Select one of the three input methods: paste data, upload a CSV/Excel file, or enter values manually. The default sample dataset (Manufacturing Quality Control) loads automatically.
Click on the green group-name fields above each textarea and type your own labels (e.g., "Machine A", "Treatment", "Site 1"). These names will appear throughout the results, charts, and reporting templates.
Paste comma-separated values into the first textarea (e.g., 52, 48, 55, 61, 47). The tool also accepts newlines, spaces, semicolons, and tabs as separators.
Paste the second sample into the second textarea. Sample sizes do not need to match — the F-test handles unequal sample sizes correctly.
The default is 0.05 (5%). Choose 0.01 for stricter testing or 0.10 for exploratory analysis. The confidence-interval level is automatically set to (1 − α) × 100%.
Two-tailed (default) tests whether the variances differ in either direction. One-tailed tests are appropriate only when there is a strong prior reason to expect a specific direction.
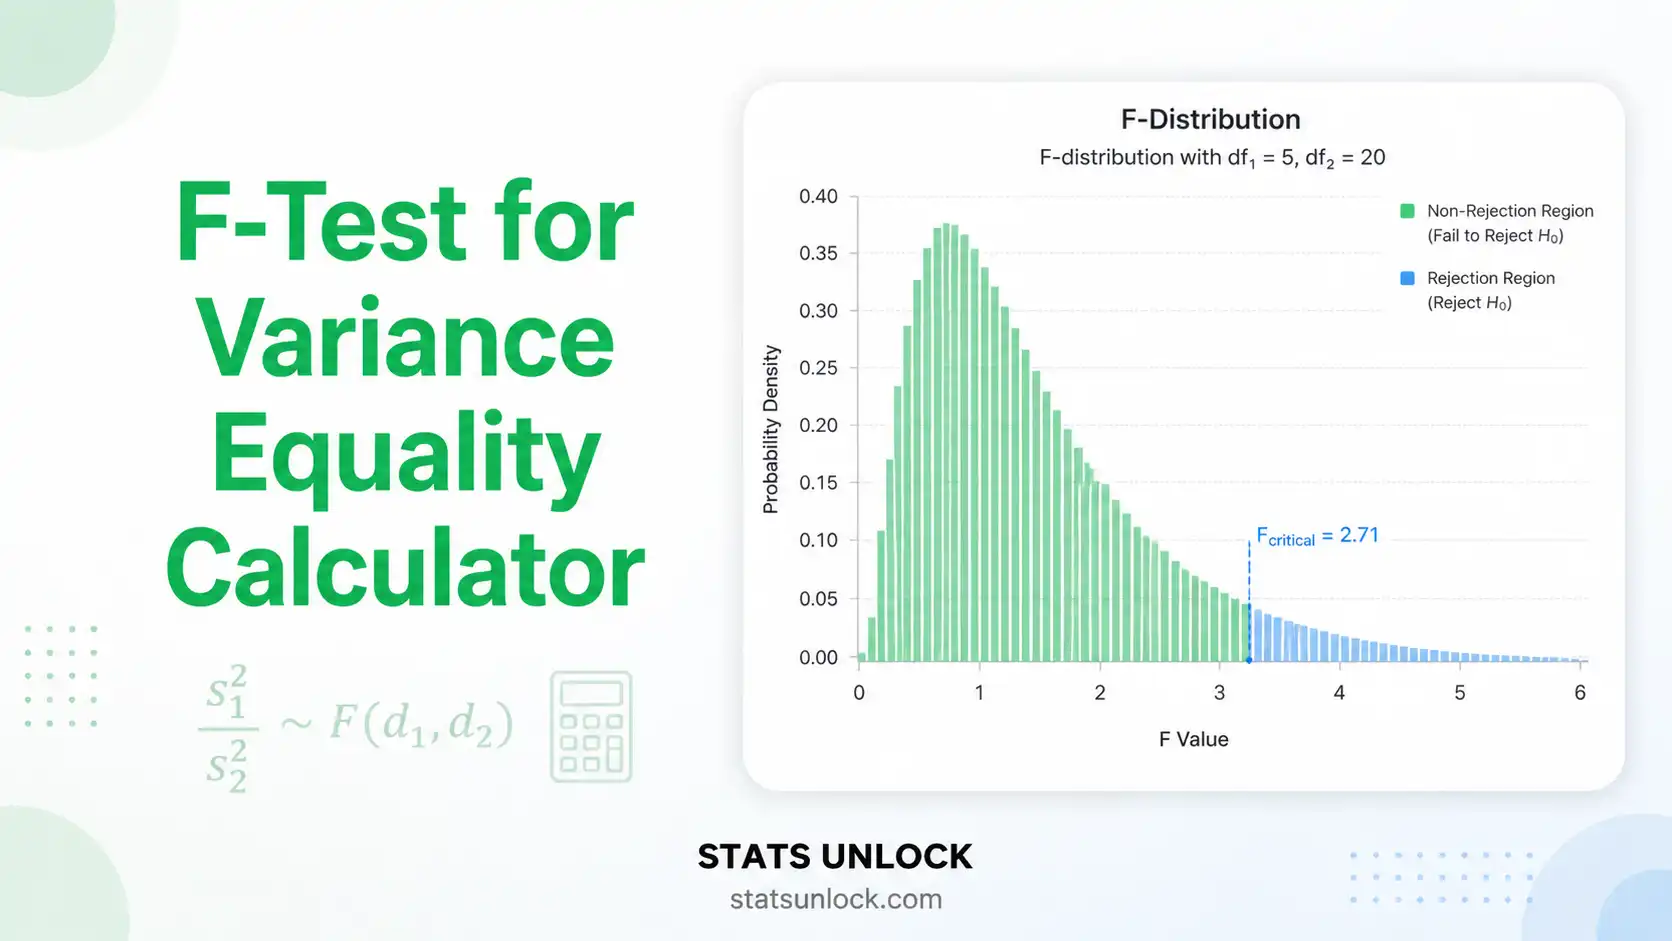
The tool computes F, df₁, df₂, p-value, variance ratio, and confidence interval, then renders the box plot and F-distribution chart.
The green or amber banner immediately below the summary cards tells you whether to reject or fail to reject the null hypothesis of equal variances at your chosen α.
Open the "Interpretation & How to Write Your Results" section to read a 5-paragraph plain-language explanation and copy any of the five auto-filled reporting templates (APA, dissertation, plain-language, abstract, pre-registration).
Click "Download Report (.txt)" for a plain-text summary or "Download PDF" to save a publication-quality PDF version using your browser's print-to-PDF feature.
❓ Frequently Asked Questions
What is the F-test for variance equality and when should I use it?
The F-test for variance equality (also called the variance ratio test or F-test for equality of two variances) compares the variances of two independent normally distributed samples to test whether they are equal in their populations. Use it before running a Student's t-test, an ANOVA, or any analysis that assumes homoscedasticity to verify the equal-variance assumption.
What is a p-value in the F-test for variance equality?
The p-value is the probability of observing an F-ratio as extreme as the one computed if the two population variances were truly equal. A p-value below α (typically 0.05) means the variances differ significantly. A p-value of 0.03 means there is a 3% chance of seeing this F-ratio if the variances were actually equal.
How do I interpret the F-statistic in the F-test for variance equality?
The F-statistic is the ratio of the larger sample variance to the smaller sample variance. An F-value near 1.0 suggests equal variances. The further F is from 1.0, the stronger the evidence against equal variances. Compare F to the critical value from the F-distribution with (n₁−1, n₂−1) degrees of freedom.
What assumptions does the F-test for variance equality require?
The F-test requires three assumptions: (1) both samples are drawn from normally distributed populations, (2) the two samples are independent, and (3) observations within each sample are independent. The F-test is highly sensitive to non-normality. If your data are non-normal, use Levene's test or the Brown-Forsythe test instead.
What is the difference between the F-test and Levene's test for variance equality?
The F-test for variance equality assumes normality and is sensitive to violations. Levene's test uses absolute deviations from the group mean (or median for Brown-Forsythe), making it robust to non-normal data. Use the F-test when normality is confirmed; use Levene's test when normality is uncertain or sample sizes are unequal.
How large a sample do I need for the F-test for variance equality?
A minimum of 10 observations per group is suggested, with 20 to 30 per group preferred for stable variance estimates. With small samples (n < 10), the F-test has very low statistical power to detect real variance differences. For meaningful conclusions about variance equality, aim for n ≥ 30 per group.
Is the F-test for variance equality one-tailed or two-tailed?
The F-test for variance equality is most often run as a two-tailed test because researchers usually want to know whether variances differ in either direction. A one-tailed F-test is used only when there is a strong prior reason to expect one specific group to have larger variance — for example, when testing whether a new method increases variability.
How do I report the F-test for variance equality in APA 7 format?
Report it as: F(df₁, df₂) = [F-value], p = [p-value]. Example: "A two-sample F-test indicated that the variance in Group 1 (s² = 24.18) was significantly larger than that in Group 2 (s² = 9.42), F(9, 9) = 2.57, p = .046." Italicise F and p, report p exactly to three decimals (or p < .001).
Can I use the F-test for variance equality calculator for published research?
This calculator is designed for educational use and exploratory data analysis. For peer-reviewed publications, verify your results in R, Python (SciPy), SPSS, or SAS. Cite the tool as: STATS UNLOCK. (2025). F-test for variance equality calculator. Retrieved from https://statsunlock.com.
What does it mean if the F-test for variance equality is non-significant?
A non-significant F-test (p > α) means the data do not provide enough evidence to reject the null hypothesis of equal variances. It does not prove the variances are equal — it only means any difference is not statistically detectable. Report the result, mention the assumption is reasonable, and proceed with tests that assume homoscedasticity.
📌 Conclusion
The F-test for variance equality is a foundational tool in classical inferential statistics — quietly powering virtually every parametric comparison researchers run. Whether you are validating the equal-variance assumption before a Student's t-test, comparing the consistency of two manufacturing processes, evaluating the volatility of two investment portfolios, or examining the spread of biological measurements between populations, the F-test gives you a precise, interpretable answer to a single question: are these two variances meaningfully different?
This calculator handles every step for you. It computes the F-statistic as the ratio of two sample variances, derives the correct numerator and denominator degrees of freedom, evaluates the two-tailed p-value against the F-distribution, and constructs a confidence interval for the variance ratio — all from comma-separated values pasted into a textarea or uploaded from a spreadsheet. You also receive a clear yes/no significance verdict, a 5-paragraph plain-language interpretation, and five ready-to-use reporting templates spanning APA 7th edition, dissertation methods, plain-language briefs, conference abstracts, and open-science pre-registration formats.
A correct interpretation requires more than just reading the p-value. The F-test is highly sensitive to non-normality, so always pair it with a normality check (Shapiro-Wilk, Q-Q plot, or histogram). Report the F-statistic with both degrees of freedom in parentheses, an exact p-value to three decimals, and the variance ratio as your effect-size metric. If the test is non-significant, do not claim the variances are equal — only that you lack evidence of inequality. If significant, prefer Welch's t-test (instead of Student's) for any subsequent mean comparison, because Welch's correction does not assume equal variances.
Use this free online F-test for variance equality calculator to make your variance-comparison work fast, transparent, and reproducible. Save the PDF, copy the APA-formatted result into your manuscript, and move on with confidence to your next analysis. For peer-reviewed publication, always cross-check against established statistical software such as R (var.test()), Python's SciPy (scipy.stats.f_oneway, f.cdf), SPSS, or SAS.
📚 References
The following references support the statistical methods used in this calculator, covering variance ratio testing, p-value interpretation, confidence intervals for variance ratios, and best practices in hypothesis testing.
- Fisher, R. A. (1925). Statistical methods for research workers. Oliver and Boyd.
- Snedecor, G. W., & Cochran, W. G. (1989). Statistical methods (8th ed.). Iowa State University Press.
- Box, G. E. P. (1953). Non-normality and tests on variances. Biometrika, 40(3/4), 318–335. https://doi.org/10.2307/2333350
- Levene, H. (1960). Robust tests for equality of variances. In I. Olkin (Ed.), Contributions to probability and statistics (pp. 278–292). Stanford University Press.
- Brown, M. B., & Forsythe, A. B. (1974). Robust tests for the equality of variances. Journal of the American Statistical Association, 69(346), 364–367. https://doi.org/10.1080/01621459.1974.10482955
- Bartlett, M. S. (1937). Properties of sufficiency and statistical tests. Proceedings of the Royal Society A, 160(901), 268–282. https://doi.org/10.1098/rspa.1937.0109
- Field, A. (2018). Discovering statistics using IBM SPSS statistics (5th ed.). SAGE Publications.
- Howell, D. C. (2013). Statistical methods for psychology (8th ed.). Cengage Learning.
- Conover, W. J., Johnson, M. E., & Johnson, M. M. (1981). A comparative study of tests for homogeneity of variances. Technometrics, 23(4), 351–361. https://doi.org/10.1080/00401706.1981.10487680
- Markowski, C. A., & Markowski, E. P. (1990). Conditions for the effectiveness of a preliminary test of variance. The American Statistician, 44(4), 322–326. https://doi.org/10.1080/00031305.1990.10475750
- American Psychological Association. (2020). Publication manual of the American Psychological Association (7th ed.). https://doi.org/10.1037/0000165-000
- R Core Team. (2024). R: A language and environment for statistical computing. R Foundation for Statistical Computing. https://www.R-project.org/
- Virtanen, P., Gommers, R., Oliphant, T. E., et al. (2020). SciPy 1.0: Fundamental algorithms for scientific computing in Python. Nature Methods, 17, 261–272. https://doi.org/10.1038/s41592-020-0772-5
- NIST/SEMATECH. (2013). e-Handbook of statistical methods. National Institute of Standards and Technology. https://www.itl.nist.gov/div898/handbook/


