🔬 MANOVA Calculator
Free online Multivariate Analysis of Variance tool — Wilks' Lambda, Pillai's Trace, effect size (η²p), p-value, and APA-format results in seconds.
📋 Data Input
Enter values for each group. Each group can have 2–6 dependent variables (DVs). Enter values comma-separated. All groups must have the same number of DVs.
Enter values directly in the grid. Each row = one observation. Each column = one dependent variable (DV). Add rows as needed.
⚙️ Test Configuration
📊 Results Summary
✅ Assumption Checks
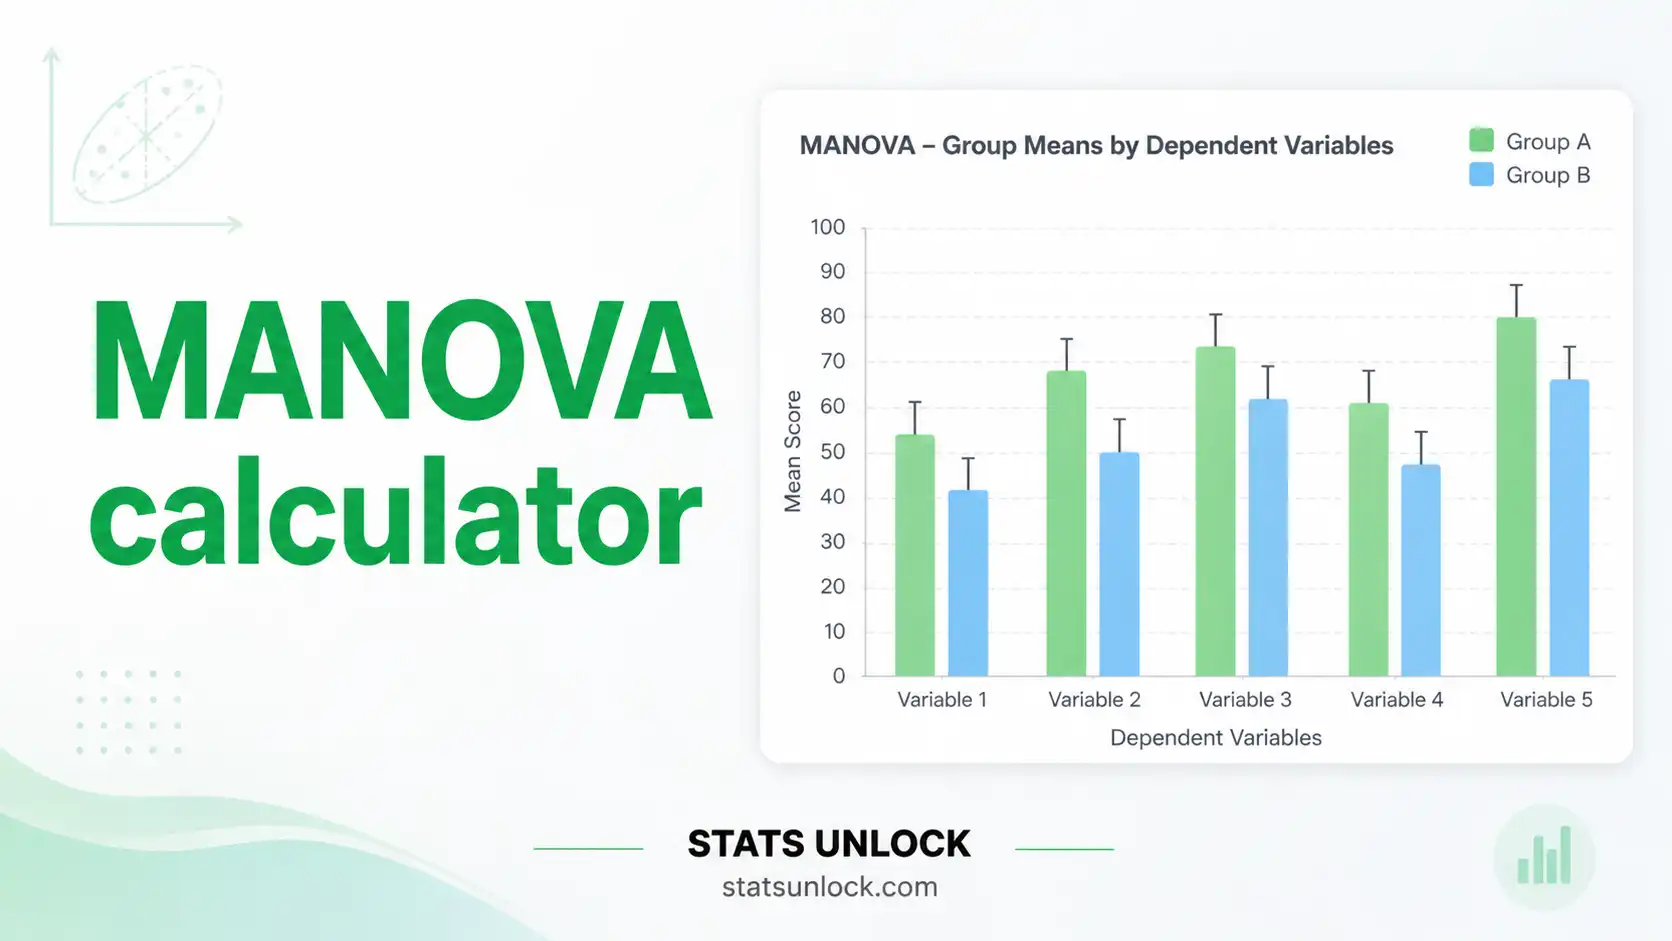
📈 Visualizations
💡 Interpretation Results
✍️ How to Write Your Results in Research
🧮 Technical Notes — Formulas Used
The MANOVA calculator uses the following formulas to compute multivariate test statistics, effect sizes, and post-hoc comparisons.
📌 When to Use MANOVA
This free MANOVA calculator is designed for researchers, students, and analysts who need to compare three or more groups across multiple continuous dependent variables simultaneously. MANOVA tests whether group centroids differ significantly in multivariate space — a question that cannot be answered by running separate ANOVAs without inflating Type I error.
✅ Use MANOVA When:
🌍 Real-World Examples
🌿 Decision Tree — MANOVA vs Alternatives
📖 How to Use This MANOVA Calculator — Step-by-Step
Follow these 10 steps to run a MANOVA analysis. The worked example uses therapy groups (CBT, Mindfulness, Control) assessed on anxiety and depression scores.
52, 48, 55, 61, 47; DV2 (Depression): 38, 35, 41, 44, 33. Each group must have the same number of DVs.❓ Frequently Asked Questions
Q1. What is MANOVA and when should I use it?
MANOVA (Multivariate Analysis of Variance) is a parametric hypothesis test that determines whether two or more groups differ significantly across two or more continuous dependent variables at the same time. It is the multivariate extension of ANOVA and is preferred over running separate ANOVAs when dependent variables are correlated, because it controls the experiment-wise Type I error rate. A classic example: comparing CBT, mindfulness, and control groups on anxiety, depression, and stress simultaneously — one MANOVA instead of three separate ANOVAs.
Q2. What is a p-value in MANOVA and how do I interpret it?
The p-value in MANOVA represents the probability of observing multivariate group differences this large (or larger) by chance, assuming the null hypothesis is true — i.e., all group centroids are equal in multivariate space. A p-value of 0.03 means there is only a 3% chance of seeing these group differences by random sampling if the groups truly did not differ. Note: the p-value is NOT the probability that the null hypothesis is true. Always pair the p-value with an effect size (Wilks' Λ or η²p) to convey the magnitude of differences.
Q3. Does statistical significance in MANOVA mean group differences are practically important?
No. Statistical significance (p < 0.05) only confirms that group differences are unlikely due to sampling error. With very large samples, even tiny group differences that are clinically or practically trivial can produce p < 0.001. Always interpret effect size alongside p-values. Partial η² below 0.06 indicates a small effect even if the MANOVA is highly significant. Report both: Wilks' Λ = 0.72, F(4, 86) = 3.89, p = .006, partial η² = .15 (large effect).
Q4. What is Wilks' Lambda and partial eta-squared, and how do I interpret them?
Wilks' Lambda (Λ) ranges from 0 to 1. A value near 0 means the groups are very well separated in multivariate space; a value near 1 means the groups overlap almost completely with no meaningful differences. Partial eta-squared (η²p) is the complementary effect size: η²p = 1 − Λ^(1/t). Cohen's (1988) benchmarks: η²p = 0.01 small, 0.06 medium, 0.14 large. So if Λ = 0.72 and η²p = 0.15, that is a large multivariate effect — 15% of the variance in the combined DV space is attributable to group membership.
Q5. What are the MANOVA assumptions and what if my data violate them?
MANOVA requires: (1) Multivariate normality — each DV should be approximately normally distributed within each group. Assess with Shapiro-Wilk per DV. MANOVA is robust when n is large (n ≥ 20 per group). (2) Homogeneity of covariance matrices — Box's M test checks this assumption. Box's M is very sensitive to non-normality, so a significant result does not always mean a real violation. MANOVA is robust to this violation when group sizes are equal. (3) Independence of observations — each participant contributes one row of data. (4) No multicollinearity — correlations among DVs should not exceed r = 0.90. If violated, remove redundant variables.
Q6. How large a sample do I need for MANOVA to be reliable?
The minimum is n > p per group (more observations than dependent variables). A practical rule of thumb is at least 20 observations per group for reliable estimates. For 80% power to detect a medium multivariate effect (η²p ≈ 0.06) with 3 groups and 2 DVs at α = 0.05, approximately 80–100 total observations are recommended. Unequal group sizes reduce the robustness of Box's M and increase sensitivity to non-normality. Always conduct a power analysis before data collection.
Q7. Why run MANOVA instead of multiple separate ANOVAs?
Running k separate ANOVAs for k dependent variables inflates the family-wise Type I error rate. With 5 DVs each tested at α = 0.05, the probability of at least one false positive is 1 − 0.95⁵ = 23% — far above the intended 5%. MANOVA tests all DVs simultaneously, keeping the overall error rate at α = 0.05. Additionally, MANOVA detects group differences that may be invisible when DVs are examined individually, because it accounts for the correlations among DVs and can detect multivariate patterns that no single ANOVA would find.
Q8. How do I report MANOVA results in APA 7th edition format?
APA 7th format: A one-way MANOVA was conducted to examine whether [groups] differed on [list of DVs]. Box's M test indicated homogeneity of covariance matrices was [satisfied/violated], Box's M = ___, F(___, ___) = ___, p = ___. There was a statistically significant multivariate effect of [IV], Wilks' Λ = ___, F(___, ___) = ___, p = ___, partial η² = ___. Univariate follow-up ANOVAs (Bonferroni-corrected α = ___) indicated significant effects for [list significant DVs]. See the "How to Write Your Results" section above for five complete auto-filled reporting templates including APA, thesis, plain-language, abstract, and pre-registration styles.
Q9. Can I use this calculator for published research or university assignments?
This MANOVA calculator is designed for educational use, learning, and exploratory analysis. For peer-reviewed publication or formal dissertation work, verify results using R (car package: Manova()), SPSS (GLM multivariate), SAS (PROC GLM), or Python (statsmodels). The mathematical approach in this tool is consistent with established multivariate statistics textbooks (Field, 2018; Tabachnick & Fidell, 2019). To cite this tool: STATS UNLOCK. (2025). MANOVA calculator. Retrieved from https://statsunlock.com/manova-calculator.
Q10. What should I do if my MANOVA result is non-significant?
A non-significant MANOVA (p > α) does not prove the groups are identical — it means the data do not provide sufficient evidence to reject the null hypothesis. This could be due to: insufficient sample size (low power), a small true effect, high within-group variability, or poorly chosen dependent variables. Check your statistical power post-hoc by estimating the power you had given your observed effect size and sample size. Consider a Bayesian MANOVA (computing Bayes Factor) to quantify evidence in favour of the null hypothesis. Also verify that the MANOVA assumptions were met, as violations can mask true effects.
📚 References
The following references support the statistical methods used in this MANOVA calculator, covering multivariate analysis of variance, effect size interpretation, Wilks' Lambda, and best practices in multivariate hypothesis testing and p-value reporting.


