One Sample Z Test Calculator
Free online z test calculator for testing whether a sample mean differs from a known population mean. Get the z-statistic, p-value, Cohen's d effect size, 95% confidence interval, APA-format reporting, and publication-ready charts in one click.
📊 Enter Your Data
Default format: comma-separated. Spaces, tabs, and newlines also accepted.
Click a cell to edit. Click "Add Row" to extend.
Use this if you only have summary statistics (no raw data).
⚙️ Test Configuration
📈 Results
Full Statistical Output
| Statistic | Value | What it means |
|---|---|---|
| No results yet — run the test to populate this table. | ||
📊 Visualizations
Sample Distribution vs Hypothesized Mean
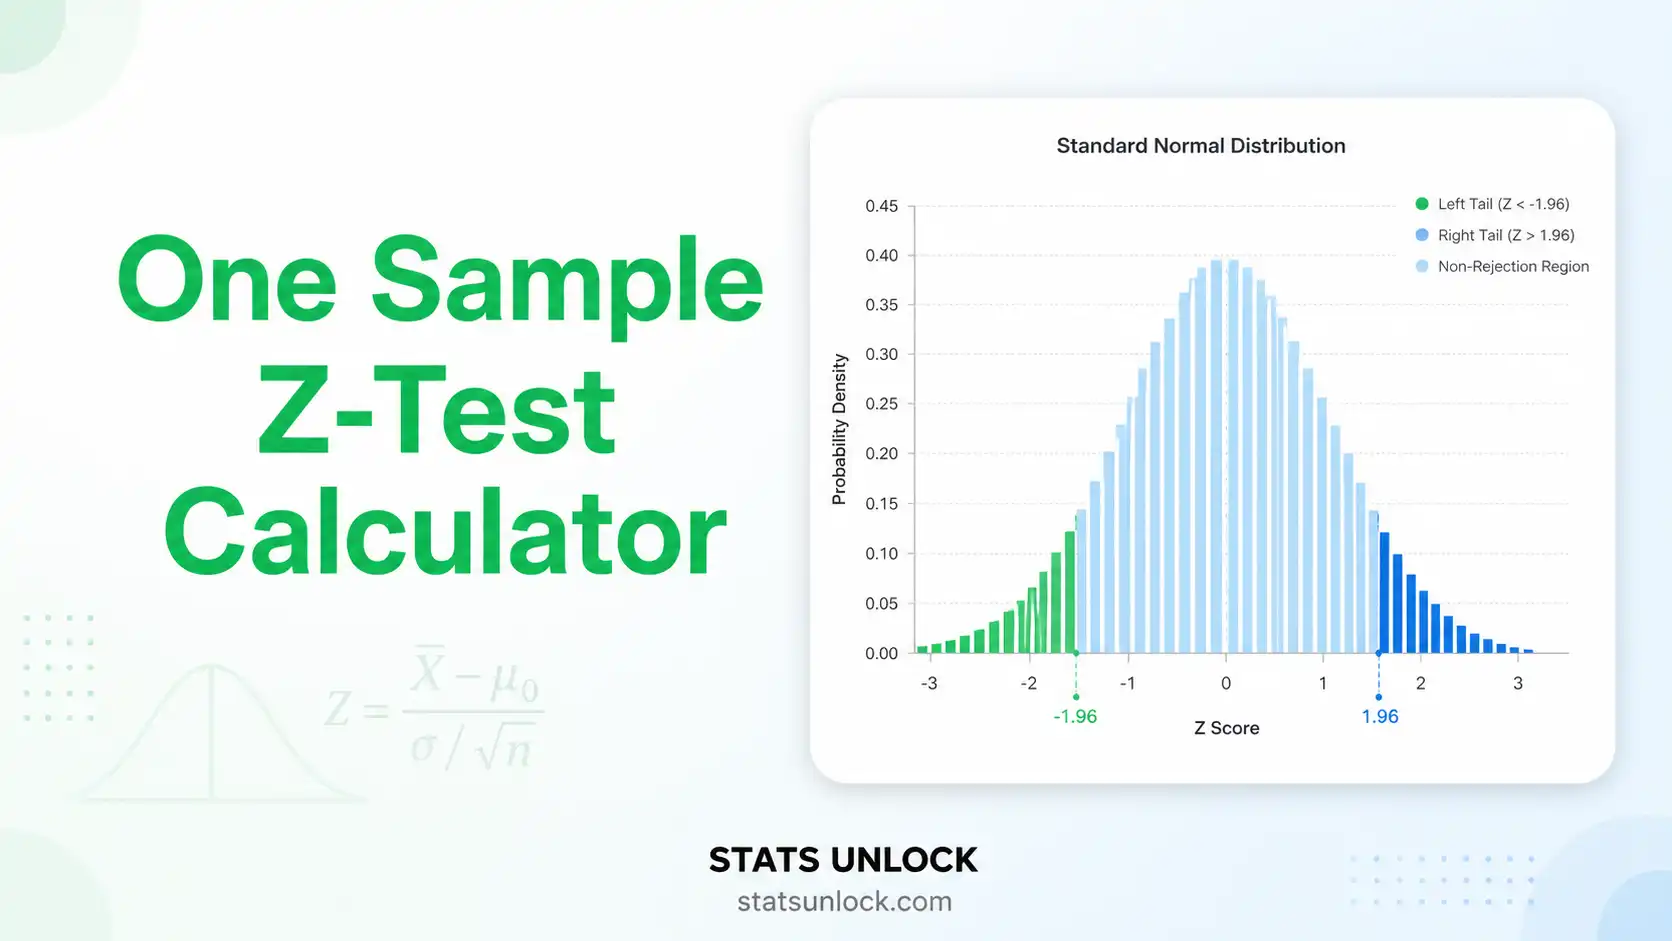
Standard Normal Distribution & Critical Region
📥 Export Results
Save your one-sample z test report in two formats. Both downloads include the full computed statistics, APA-format reporting, plain-language interpretation, assumption checks, and references — ready to paste into your manuscript, thesis, or presentation.
Plain-Text Document (.txt)
A clean text report containing all summary statistics, test results, decision, and APA-format reporting. Best for copying into Word, Google Docs, LaTeX, or email.
- ✓ All summary statistics (n, M, SD, σ, μ₀, SEM)
- ✓ Z-statistic, p-value, Cohen's d, 95% CI
- ✓ Significance decision
- ✓ Ready-to-paste APA 7 reporting sentence
Formatted PDF Report (A4)
A publication-ready A4 PDF with cover, statistical tables, plain-language interpretation, APA reporting, assumption checks, and references — fully formatted with StatsUnlock branding.
- ✓ Cover page + branded header
- ✓ Statistical results table
- ✓ 5-paragraph plain-language interpretation
- ✓ APA 7 reporting + assumption summary
- ✓ Numbered reference list
💡 Plain Language Interpretation
📖 Detailed Interpretation Results
What Was Found
Run the analysis above to populate the detailed interpretation with your data.
✍️ How to Write Your Results in Research
Below are five ready-to-paste reporting templates, each auto-filled with your computed statistics. Pick the one that matches your audience.
🎯 Detailed Conclusion
Run the analysis above to generate a full conclusion section based on your data.
✅ Assumption Checks
🧭 When to Use a One-Sample Z Test
This free one sample z test calculator is designed for any situation where you need to determine if a sample mean differs significantly from a known population mean, given that the population standard deviation (σ) is known.
✓ Use this test when:
- You have one sample of continuous, numeric data and want to compare its mean to a known population mean (μ₀).
- The population standard deviation (σ) is known from prior research, historical data, or a quality-control specification.
- Your sample size is large (n ≥ 30) so that the Central Limit Theorem applies, OR your population is approximately normally distributed.
- Observations are independent and drawn through random sampling.
- You want a quick, parametric hypothesis test with a closed-form p-value and confidence interval.
📋 Real-World Examples
Education
Did this year's class score differently from the long-term national average of 80 (σ = 6)?
Manufacturing
Does the mean weight of bolts coming off a production line differ from the spec of 50 g (σ = 0.8)?
Healthcare
Is the average cholesterol level of 35 patients different from the population mean of 200 mg/dL (σ = 25)?
Psychology
Does a 40-participant cohort have reaction times differing from the established norm of 250 ms (σ = 30)?
🚦 Decision Tree — Z Test or T Test?
Step 1. Is σ (population SD) known? → YES → continue. NO → use a one-sample t-test.
Step 2. Is n ≥ 30 OR data approximately normal? → YES → use the One-Sample Z Test (this tool).
Step 3. Are observations independent and randomly sampled? → YES → proceed.
Step 4. If σ is known but n < 30 and data are non-normal → consider a non-parametric Wilcoxon signed-rank test.
📘 How to Use This One Sample Z Test Calculator (10 Steps)
Enter Your Data
Paste comma-separated values into the textarea, OR upload a CSV/Excel file, OR enter values manually, OR plug in summary statistics. Example: 82, 75, 88, 91, 79, 85, ...
Choose a Sample Dataset
Five built-in datasets (education, medical, manufacturing, psychology, HR) let you explore the tool without uploading data. Dataset 1 (Class Test Scores) is loaded by default.
Set the Hypothesized Mean (μ₀) and Sigma (σ)
μ₀ is the population mean you are testing against (e.g., the national average, the spec value). σ is the known population standard deviation.
Choose Significance Level (α)
0.05 is the most common (95% CI). Use 0.01 for stricter evidence or 0.10 for exploratory work.
Pick Tail Direction
Two-tailed for "different from"; left-tailed for "less than"; right-tailed for "greater than". Default to two-tailed unless you have a directional hypothesis pre-specified.
Run the Analysis
Click "Run One-Sample Z Test". The summary cards, results table, charts, and interpretation populate instantly.
Read the Summary Cards
Z-statistic, p-value, Cohen's d, and decision are highlighted. Green = significant; amber = non-significant.
Examine the Charts
Chart 1 shows your sample distribution against μ₀. Chart 2 shows the standard normal curve with your z-statistic and the rejection region shaded.
Read the Interpretation & Pick a Reporting Style
Five reporting templates (APA, Thesis, Plain-Language, Conference Abstract, Pre-Registration) auto-fill with your statistics — copy-paste straight into your manuscript.
Export Your Results
"Download Doc" gives a plain-text .txt report. "Download PDF" opens the print dialog — choose "Save as PDF" for a formatted A4 report.
🧮 Formulas & Technical Notes
Z-Statistic
Cohen's d (Effect Size)
Standard Error of the Mean (SEM)
Confidence Interval for μ
P-value (Two-Tailed)
Where:
x̄ = sample mean | μ₀ = hypothesized population mean | σ = known population SD
n = sample size | Φ = standard normal CDF | zα/2 = critical value at α/2
Cohen's d benchmarks (Cohen, 1988): |d| ≈ 0.2 small, 0.5 medium, 0.8 large.
The p-value uses the standard normal distribution (mean = 0, SD = 1) because σ is assumed known.
❓ Frequently Asked Questions
Q1. What is a one sample z test calculator and when should I use it?
A one sample z test calculator compares a sample mean to a known population mean when the population standard deviation (σ) is known. Use it when σ is given (or n is large, n ≥ 30) and the data are approximately normal. Typical use: testing whether a class scored higher than the national mean, or whether a manufactured part deviates from spec.
Q2. What is a p-value, and how do I interpret it for the z test?
The p-value is the probability of observing a sample mean as extreme as yours (or more extreme) if the null hypothesis were true. A p-value of 0.03 means there is a 3% chance of seeing this result by chance alone. If p < α (e.g., 0.05), reject H₀.
Important: p is NOT the probability that H₀ is true.
Q3. What does statistical significance mean — and is it the same as practical importance?
Statistical significance (p < α) only tells you that the result is unlikely under H₀. Practical importance is captured by the effect size (Cohen's d). With a very large sample, tiny meaningless differences can become statistically significant. Always report and interpret both p and d.
Q4. What is Cohen's d for a one sample z test, and how do I interpret it?
Cohen's d for a one-sample z test = (x̄ − μ₀) / σ. Benchmarks (Cohen, 1988): |d| ≈ 0.2 small, 0.5 medium, 0.8 large. A d of 0.8 means the sample mean lies 0.8 standard deviations above (or below) the hypothesized population mean — a difference usually visible in practice.
Q5. What assumptions does the one-sample z test require?
Three core assumptions: (1) the population SD σ is known; (2) observations are independent and from a random sample; (3) the sampling distribution of the mean is approximately normal — guaranteed if n ≥ 30 by the Central Limit Theorem; otherwise the population itself should be roughly normal.
If σ is unknown, switch to a one-sample t-test.
Q6. How large a sample do I need for a one sample z test to be reliable?
A common rule of thumb is n ≥ 30 so the CLT makes the sampling distribution approximately normal. For 80% power to detect a medium effect (d = 0.5) at α = 0.05 (two-tailed), n ≈ 32. To detect a small effect (d = 0.2), you need around n = 197.
Q7. What is the difference between one-tailed and two-tailed z tests, and which should I choose?
A two-tailed test detects deviation in either direction (mean ≠ μ₀) and splits α across both tails. A one-tailed test commits in advance to a direction (> or <) and is more powerful, but only valid if the direction is pre-specified theoretically. Use two-tailed by default unless you have a strong, pre-registered directional hypothesis.
Q8. How do I report one-sample z test results in APA 7th edition format?
APA template: "A one-sample z test was conducted comparing the sample mean (M = ___, SD = ___, N = ___) to the hypothesized population mean (μ₀ = ___, σ = ___); the difference was [significant / non-significant], z = ___, p = ___, Cohen's d = ___, 95% CI [___, ___]." Italicize z, p, M, SD, d. See "How to Write Your Results" above for five filled-in templates.
Q9. Can I use this calculator for my published research or university assignment?
Yes — this tool is designed for educational use, coursework, and exploratory analysis. For peer-reviewed publication, replicate the calculation in R, Python, SPSS, or SAS to confirm. Cite as: STATS UNLOCK. (2025). One sample z test calculator. Retrieved from https://statsunlock.com/one-sample-z-test-calculator/.
Q10. What if my z test result is non-significant — does that mean my hypothesis is wrong?
No. A non-significant result (p > α) only means the data do not provide enough evidence to reject H₀; it does not prove H₀ is true. Possible reasons: low statistical power, small sample size, or the true effect being smaller than expected. Run a power analysis or compute a Bayes factor to quantify evidence in favor of H₀.
📚 References
Authoritative sources used in building this calculator, covering hypothesis testing methodology, p-value interpretation, effect size benchmarks, and APA reporting standards. All references follow APA 7th edition format with DOIs or URLs where available.
- American Psychological Association. (2020). Publication manual of the American Psychological Association (7th ed.). https://doi.org/10.1037/0000165-000
- Cohen, J. (1988). Statistical power analysis for the behavioral sciences (2nd ed.). Lawrence Erlbaum Associates.
- Wasserstein, R. L., & Lazar, N. A. (2016). The ASA's statement on p-values: Context, process, and purpose. The American Statistician, 70(2), 129–133. https://doi.org/10.1080/00031305.2016.1154108
- Wasserstein, R. L., Schirm, A. L., & Lazar, N. A. (2019). Moving to a world beyond "p < 0.05". The American Statistician, 73(sup1), 1–19. https://doi.org/10.1080/00031305.2019.1583913
- Lakens, D. (2013). Calculating and reporting effect sizes to facilitate cumulative science: A practical primer for t-tests and ANOVAs. Frontiers in Psychology, 4, 863. https://doi.org/10.3389/fpsyg.2013.00863
- Field, A. (2018). Discovering statistics using IBM SPSS Statistics (5th ed.). SAGE Publications.
- Hoekstra, R., Morey, R. D., Rouder, J. N., & Wagenmakers, E.-J. (2014). Robust misinterpretation of confidence intervals. Psychonomic Bulletin & Review, 21(5), 1157–1164. https://doi.org/10.3758/s13423-013-0572-3
- Faul, F., Erdfelder, E., Lang, A.-G., & Buchner, A. (2007). G*Power 3: A flexible statistical power analysis program for the social, behavioral, and biomedical sciences. Behavior Research Methods, 39(2), 175–191. https://doi.org/10.3758/BF03193146
- Cumming, G. (2014). The new statistics: Why and how. Psychological Science, 25(1), 7–29. https://doi.org/10.1177/0956797613504966
- Greenland, S., Senn, S. J., Rothman, K. J., Carlin, J. B., Poole, C., Goodman, S. N., & Altman, D. G. (2016). Statistical tests, P values, confidence intervals, and power: A guide to misinterpretations. European Journal of Epidemiology, 31(4), 337–350. https://doi.org/10.1007/s10654-016-0149-3
- Kirkwood, B. R., & Sterne, J. A. C. (2003). Essential medical statistics (2nd ed.). Blackwell Science.
- R Core Team. (2024). R: A language and environment for statistical computing. R Foundation for Statistical Computing. https://www.R-project.org/
- Virtanen, P., Gommers, R., Oliphant, T. E., et al. (2020). SciPy 1.0: Fundamental algorithms for scientific computing in Python. Nature Methods, 17, 261–272. https://doi.org/10.1038/s41592-020-0772-5


