


Pearson Correlation Calculator
Compute Pearson's r, p-value, R², confidence intervals, and effect size — with scatter plot, APA write-up, and detailed interpretation.
| # | Variable X | Variable Y |
|---|
| Statistic | Value | Description |
|---|
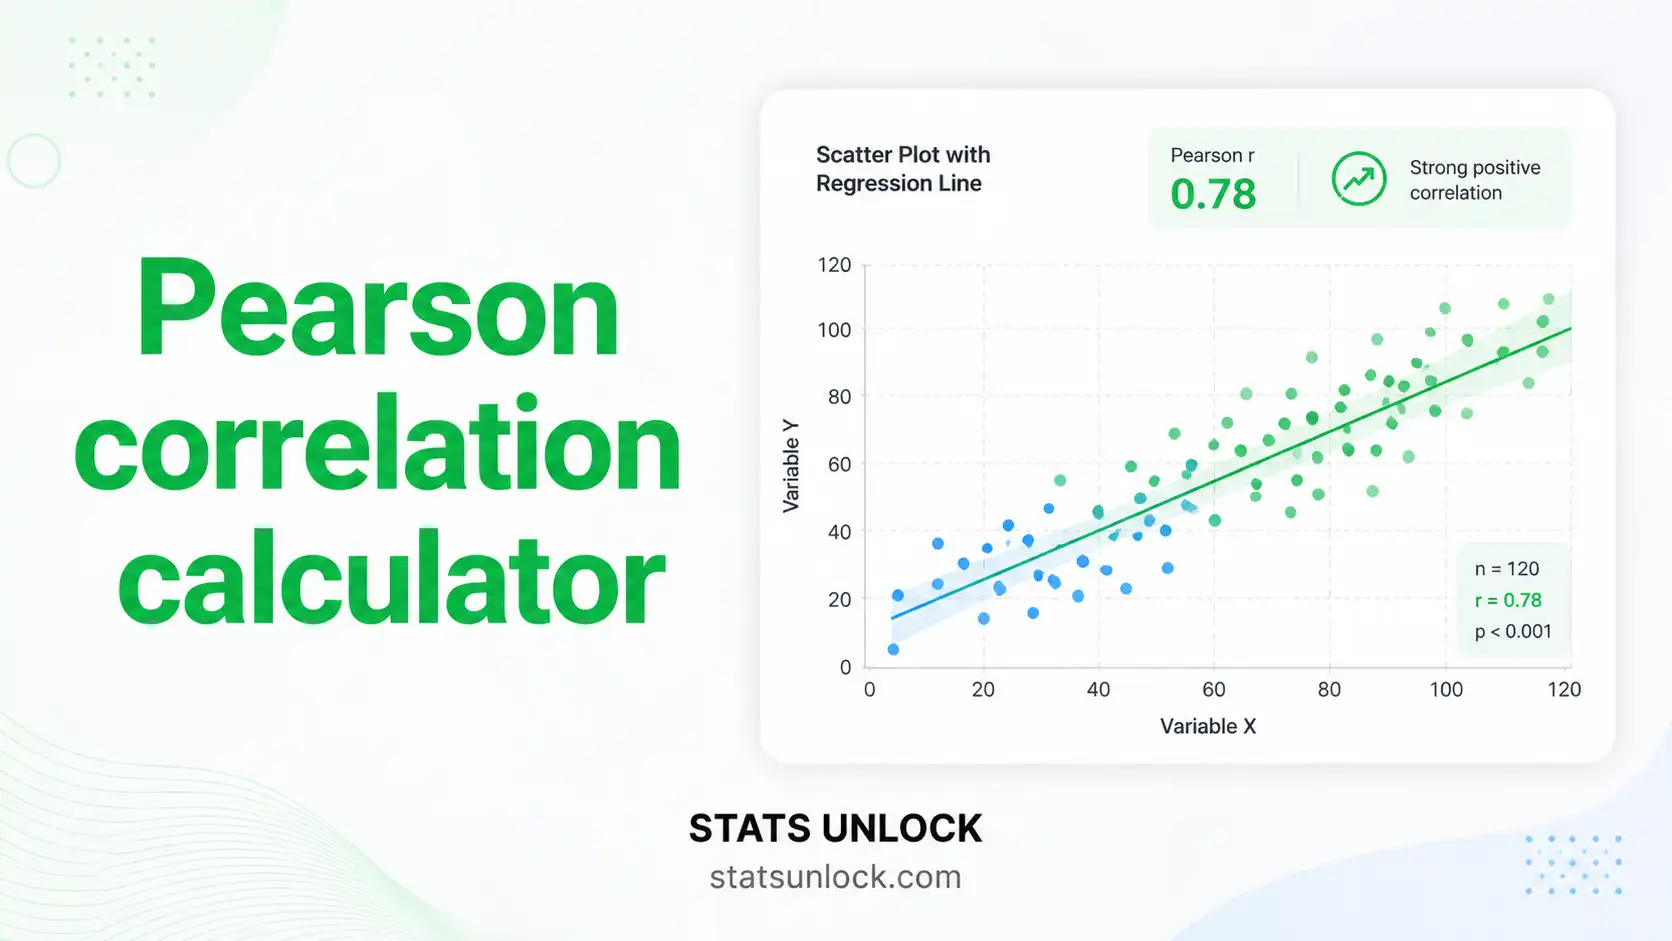
Scatter Plot with Regression Line
Residuals Plot (Fitted vs Residuals)
t-Distribution with Rejection Regions
Correlation Strength Gauge
View Formulas Used in This Calculator
Pearson Correlation Coefficient (r)
t-Statistic (Significance Test)
Coefficient of Determination (R²)
Fisher's z Confidence Interval
Least-Squares Regression Line
Standard Error of r
Correlation Strength Benchmarks
| |r| Range | Evans (1996) | Cohen (1988) |
|---|---|---|
| < 0.20 | Very Weak | Negligible |
| 0.20 – 0.39 | Weak | Small |
| 0.40 – 0.59 | Moderate | Medium |
| 0.60 – 0.79 | Strong | Large |
| 0.80 – 1.00 | Very Strong | Very Large |
Enter Your Data
Type or paste comma-separated values for Variable X and Variable Y. Each pair must correspond to the same observation (e.g., observation 1: x₁, y₁). You can also upload a .csv or .xlsx file.
Load a Sample Dataset (Optional)
Choose from five built-in datasets covering ecology, education, health, and wildlife biology to see how the calculator works with real data.
Edit Variable Names
Click the name fields next to "Variable X" and "Variable Y" and type your own labels (e.g., "Body Weight", "Heart Rate"). These labels appear throughout the results and write-up templates.
Set Configuration Options
Choose your alpha level (default: 0.05), tail type (two-tailed recommended), and confidence level. For testing H₀: ρ ≠ 0 (most common in research), leave the default settings unchanged.
Click "Calculate Pearson r"
The calculator computes Pearson's r, t-statistic, degrees of freedom, p-value, R², and Fisher's z confidence interval instantly. All formulas used are shown in the Technical Notes section.
Read the Detailed Interpretation
A five-paragraph interpretation appears automatically — covering the nature of the correlation, statistical significance, CI precision, practical effect size, and important limitations (outliers, non-linearity, causation).
Copy a Write-Up Template
Five ready-to-use write-up styles are generated: APA 7th edition, Thesis/Dissertation, Plain Language, Structured Abstract (conference poster), and Replication/Pre-Registration format. All values are auto-filled.
Explore the Four Charts
A scatter plot with regression line, a residuals plot, a t-distribution with rejection regions, and a correlation strength gauge all appear below the results table. Use them to visually assess linearity, homoscedasticity, and effect magnitude.
Check Your Assumptions
The Assumption Checks panel automatically flags potential concerns about normality (based on skewness) and outliers (IQR method), and gives guidance on what to do if assumptions are violated.
Download Results
Export a complete plain-text report (Download Doc) or print a clean PDF version containing all statistics, interpretations, and recommendations for your research file or supplementary materials.
Use Pearson Correlation When:
- Both variables are continuous (interval or ratio scale)
- The relationship between variables appears linear on a scatter plot
- Both variables are approximately normally distributed
- You have at least n = 10 paired observations
- No major outliers distort the data
- You want to measure strength AND direction of a relationship
- You are testing H₀: ρ = 0 in the population
- You need an APA-reportable effect size for a manuscript
Do NOT Use Pearson When:
- Variables are ordinal or categorical → use Spearman or Kendall's tau
- The scatter plot shows a clearly curved (non-linear) pattern
- Major outliers are present → Spearman is more robust
- Sample size is extremely small (n < 5) — unreliable results
- Data are censored or truncated → use survival analysis
- You want to prove causation — correlation alone cannot do this
What is the Pearson correlation coefficient?
How do you interpret a Pearson r value?
What is a good Pearson correlation value?
What is the difference between Pearson and Spearman correlation?
How is the p-value calculated in Pearson correlation?
What sample size do I need for Pearson correlation?
What are the assumptions of Pearson correlation?
What is R-squared and why does it matter?
How do you report Pearson correlation in APA 7th edition?
Does correlation imply causation?
How is the Fisher z confidence interval calculated?
How is Pearson correlation used in wildlife and ecology research?
What is the effect of outliers on Pearson r?
What is the difference between correlation and simple linear regression?
How do I know if my correlation is practically significant?
The Pearson correlation coefficient (r) is one of the most fundamental tools in quantitative research. First derived by Karl Pearson in 1895, it provides a single standardised number — ranging from −1 to +1 — that concisely captures both the strength and direction of a linear relationship between two continuous variables. Its mathematical elegance lies in being scale-invariant and dimensionless, allowing researchers to compare associations across variables measured in entirely different units.
When applying Pearson correlation, four conditions should be confirmed: both variables should be continuous (interval or ratio scale), the relationship should appear linear on a scatter plot, both variables should be approximately normally distributed (especially important for small samples), and no major outliers should be present. Violations of these assumptions — particularly influential outliers and non-linearity — can render the Pearson r seriously misleading. In such cases, Spearman rank correlation or Kendall's tau are more appropriate and robust alternatives that should be computed and reported alongside Pearson r for transparency.
A distinction every researcher must internalise is the difference between statistical significance and practical significance. With large samples (n ≥ 200), even very weak correlations (r = 0.10) may reach p < 0.05 — but such a correlation explains only 1% of variance, which is scientifically trivial in most contexts. Conversely, with very small samples (n = 8), a genuinely moderate correlation (r = 0.55) may not reach significance simply due to insufficient statistical power. This is why researchers must always report the confidence interval for r alongside the p-value: the CI communicates both the precision of the estimate and the plausible range of true population values.
The coefficient of determination (r²) is often the most practically meaningful output. If r = 0.70, then r² = 0.49, telling us that approximately 49% of the variance in Y is explained by its linear relationship with X. This is far more informative than the p-value alone, because it directly answers the question "how much does knowing X help us predict Y?" Always report r² (or the equivalent effect size) in research papers, dissertations, and technical reports — it is required by APA 7th edition guidelines and increasingly expected by peer reviewers.
In ecological and wildlife research, Pearson correlation is routinely applied to examine relationships between environmental gradients and biological responses — for example, how annual rainfall amount predicts plant biomass, how prey density influences predator activity patterns, or how GPS-derived movement parameters correlate with habitat quality metrics. Field biologists working with camera-trap data, GPS telemetry, or morphometric datasets will frequently report correlation coefficients as a foundational step before applying regression modelling or multivariate ordination methods such as PCA or NMDS.
Finally, and most critically: correlation does not imply causation. No matter how large or statistically significant a Pearson r value is, it cannot, by itself, establish a causal mechanism. Unmeasured confounding variables, reverse causation, or coincidental co-variation may entirely explain an observed association. Proving causation requires controlled experimental designs with random assignment, or advanced causal inference frameworks (instrumental variables, regression discontinuity, difference-in-differences). Use Pearson correlation as a powerful tool for describing and quantifying bivariate associations — but always report it completely (r, df, p, CI, r²), interpret it cautiously, and embed it within the broader context of your study design, theoretical framework, and research question.
📚 References
This Pearson correlation calculator follows statistical methods validated by peer-reviewed literature on linear correlation analysis, significance testing, Fisher's z transformation, confidence interval estimation, and effect size reporting. References follow APA 7th edition format with active DOI links.
- Pearson, K. (1895). Notes on regression and inheritance in the case of two parents. Proceedings of the Royal Society of London, 58, 240–242. https://doi.org/10.1098/rspl.1895.0041
- Cohen, J. (1988). Statistical power analysis for the behavioral sciences (2nd ed.). Lawrence Erlbaum Associates. https://doi.org/10.4324/9780203771587
- Fisher, R. A. (1915). Frequency distribution of the values of the correlation coefficient in samples from an indefinitely large population. Biometrika, 10(4), 507–521. https://doi.org/10.2307/2331838
- Evans, J. D. (1996). Straightforward statistics for the behavioral sciences. Brooks/Cole.
- Field, A. (2018). Discovering statistics using IBM SPSS statistics (5th ed.). SAGE Publications. https://doi.org/10.4135/9781526419521
- Schober, P., Boer, C., & Schwarte, L. A. (2018). Correlation coefficients: Appropriate use and interpretation. Anesthesia & Analgesia, 126(5), 1763–1768. https://doi.org/10.1213/ANE.0000000000002864
- Bishara, A. J., & Hittner, J. B. (2012). Testing the significance of a correlation with nonnormal data: Comparison of Pearson, Spearman, transformation, and resampling approaches. Psychological Methods, 17(3), 399–417. https://doi.org/10.1037/a0028087
- Bland, J. M., & Altman, D. G. (1994). Correlation, regression, and repeated data. BMJ, 308(6933), 896. https://doi.org/10.1136/bmj.308.6933.896
- Nakagawa, S., & Cuthill, I. C. (2007). Effect size, confidence interval and statistical significance: A practical guide for biologists. Biological Reviews, 82(4), 591–605. https://doi.org/10.1111/j.1469-185X.2007.00027.x
- Goodman, S. N. (1999). Toward evidence-based medical statistics. 1: The p value fallacy. Annals of Internal Medicine, 130(12), 995–1004. https://doi.org/10.7326/0003-4819-130-12-199906150-00008
- Wilcox, R. R. (2012). Introduction to robust estimation and hypothesis testing (3rd ed.). Academic Press. https://doi.org/10.1016/C2010-0-67044-1
- Curran-Everett, D. (2018). Explorations in statistics: Correlation. Advances in Physiology Education, 42(3), 532–537. https://doi.org/10.1152/advan.00000.2018
- American Psychological Association. (2020). Publication manual of the American Psychological Association (7th ed.). APA. https://doi.org/10.1037/0000165-000
- Zar, J. H. (2010). Biostatistical analysis (5th ed.). Pearson Prentice Hall. https://www.pearson.com/en-us/subject-catalog/p/biostatistical-analysis/P200000003374
- Altman, D. G., & Bland, J. M. (1995). Absence of evidence is not evidence of absence. BMJ, 311(7003), 485. https://doi.org/10.1136/bmj.311.7003.485