Percentile Calculator (P1-P99)
Compute any percentile from raw data instantly. Full descriptive statistics, publication-ready charts, and APA reporting.
| # | Value |
|---|
Quick presets or click individual chips below:
| Percentile | Label | Value | Interpretation |
|---|
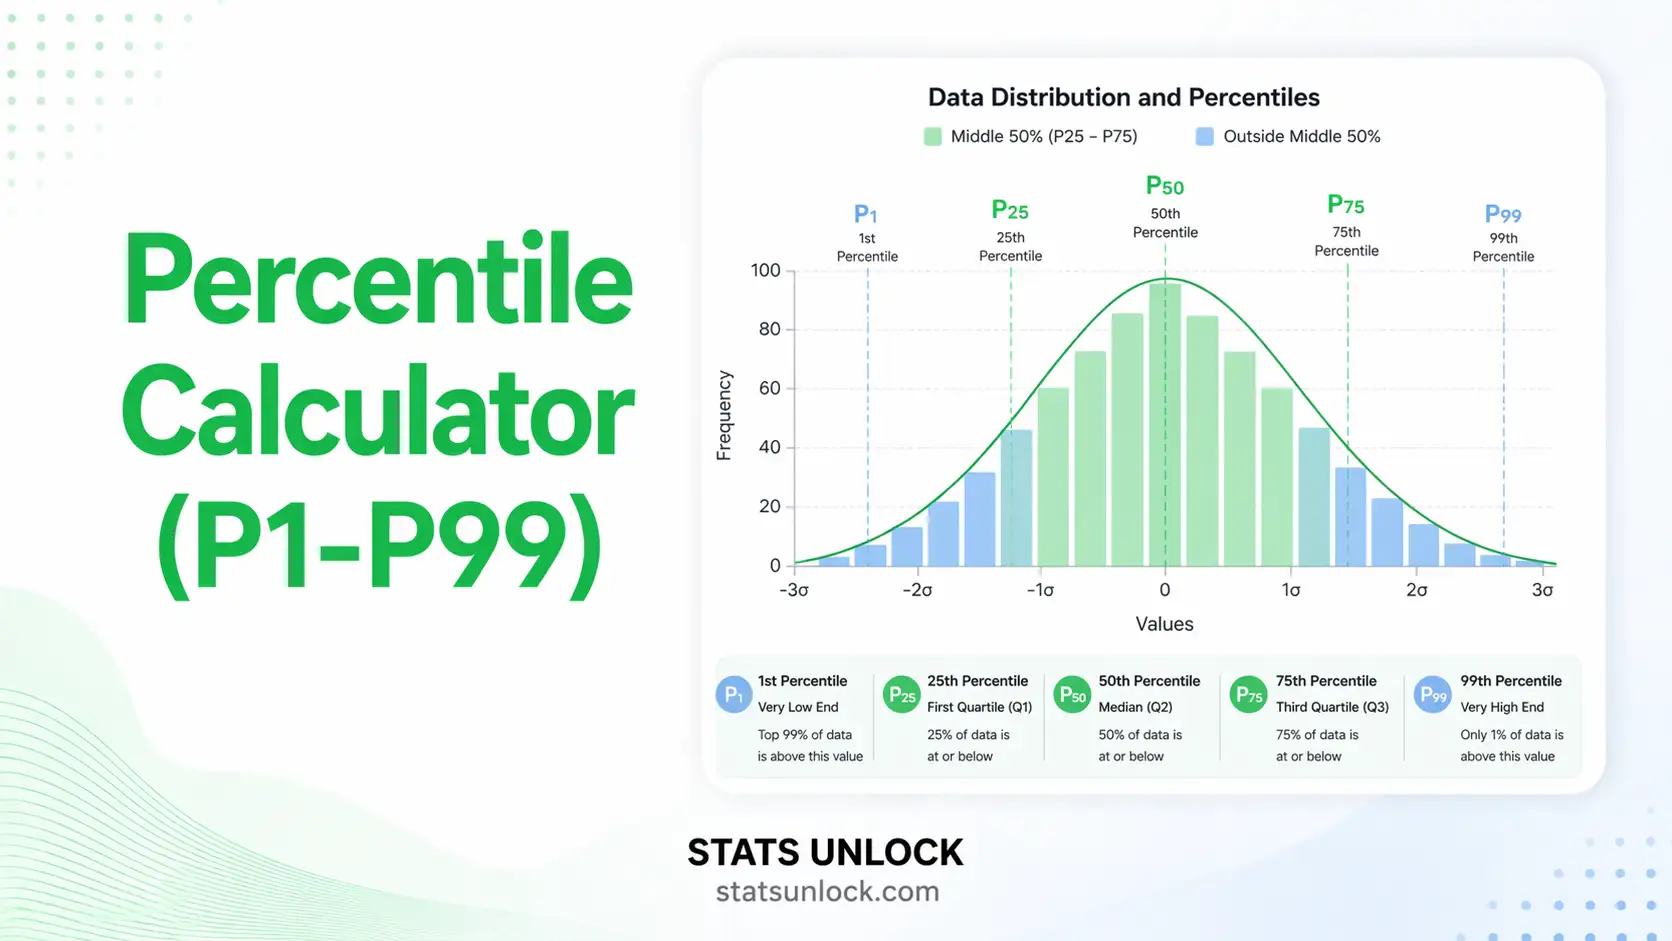
Percentile Distribution
Histogram with IQR Band
Click to expand formulas and methodology
Linear Interpolation (Type 7):
Key Relationships:
- Comparing an individual score against a reference population
- Identifying outliers and extreme values without assuming normality
- Growth charts, standardised test reporting, and clinical reference ranges
- Income distribution, salary benchmarking, and economic inequality analysis
- Environmental and ecological data where distributions are typically skewed
- Any situation where data are ordinal, skewed, or contain outliers
What is a percentile in statistics?
A percentile is a value below which a given percentage of observations fall. P75 means 75% of all values are below that point. Widely used in education (test scores), medicine (growth charts), and economics (income distribution).
How do you calculate the P50 (median) percentile?
Sort data ascending. For n values: if n is odd, P50 is value at position (n+1)/2; if n is even, average positions n/2 and n/2+1. With linear interpolation (Type 7): L = 0.5*(n-1), then interpolate between adjacent values.
What is the difference between percentile and percentage?
A percentage is a ratio out of 100 (e.g., 80% correct). A percentile describes position in a ranked group — scoring at P80 means outperforming 80% of peers, regardless of the raw score.
What interpolation method does this calculator use?
Default: Linear Interpolation (Type 7) — identical to R's quantile() and Excel's PERCENTILE.INC. Formula: L=(p/100)*(n-1), then interpolate between sorted[floor(L)] and sorted[ceil(L)]. Nearest Rank is common in textbooks.
What is the difference between percentile and quartile?
Quartiles divide data into 4 equal parts: Q1=P25, Q2=P50, Q3=P75. Percentiles give finer resolution, dividing data at 99 cut-points across 100 equal intervals.
How many data points do I need for reliable percentiles?
For middle percentiles (P25, P50, P75), 20-30 observations give reasonable estimates. For extreme percentiles (P1, P99), a minimum of 100 observations is recommended to avoid instability.
Can I use this calculator for grouped data?
This tool works with raw ungrouped numeric values. For grouped frequency data use: Pp = L + ((p*n/100 - F) / f) * h, where L=lower class boundary, F=cumulative frequency before class, f=class frequency, h=class width.
What does the 90th percentile mean?
A value at P90 exceeds 90% of all values. Only the top 10% are above it. In test score contexts, P90 means scoring higher than 9 out of 10 peers.
How do I report percentiles in APA format?
Use: "The 25th, 50th, and 75th percentiles were X, Y, and Z, respectively (IQR = W)." For a single value: "The median (P50) was M = X." Always report sample size (n) alongside percentile values.
How does this tool compare to Excel PERCENTILE function?
Linear (Type 7) mode is mathematically identical to Excel's PERCENTILE.INC function. Results match Excel to rounding precision for the same dataset. Nearest Rank approximates PERCENTILE.EXC.
What are deciles and how do they relate to percentiles?
Deciles divide data into 10 equal parts: D1=P10, D2=P20, ..., D9=P90. They are specific percentiles at multiples of 10. Select the "Deciles" preset to compute all nine decile values.
How do I find P25, P50, P75 from raw data step by step?
1) Sort data ascending. 2) For P25 with n values: L = 0.25*(n-1). 3) P25 = data[floor(L)] + frac(L)*(data[ceil(L)]-data[floor(L)]). Example: n=10, L=2.25, P25 = data[2] + 0.25*(data[3]-data[2]).
The following references support the percentile calculator, descriptive statistics percentile methods, and P1 to P99 percentile interpolation techniques used in this tool.
- Hyndman, R. J., & Fan, Y. (1996). Sample quantiles in statistical packages. The American Statistician, 50(4), 361-365. https://doi.org/10.2307/2684934
- Langford, E. (2006). Quartiles in elementary statistics. Journal of Statistics Education, 14(3). https://doi.org/10.1080/10691898.2006.11910589
- Tukey, J. W. (1977). Exploratory data analysis. Addison-Wesley.
- Frigge, M., Hoaglin, D. C., & Iglewicz, B. (1989). Some implementations of the boxplot. The American Statistician, 43(1), 50-54.
- Field, A. (2018). Discovering statistics using IBM SPSS statistics (5th ed.). SAGE Publications.
- American Psychological Association. (2020). Publication manual of the APA (7th ed.). https://doi.org/10.1037/0000165-000
- Moore, D. S., McCabe, G. P., & Craig, B. A. (2021). Introduction to the practice of statistics (10th ed.). W. H. Freeman.
- Hogg, R. V., McKean, J. W., & Craig, A. T. (2019). Introduction to mathematical statistics (8th ed.). Pearson.
- R Core Team. (2024). R: A language and environment for statistical computing. https://www.r-project.org/
- NumPy Developers. (2024). numpy.percentile documentation. https://numpy.org/doc/stable/
- Rousseeuw, P. J., & Croux, C. (1993). Alternatives to the median absolute deviation. JASA, 88(424), 1273-1283.
- National Center for Health Statistics. (2022). CDC Growth Charts. https://www.cdc.gov/growthcharts/


