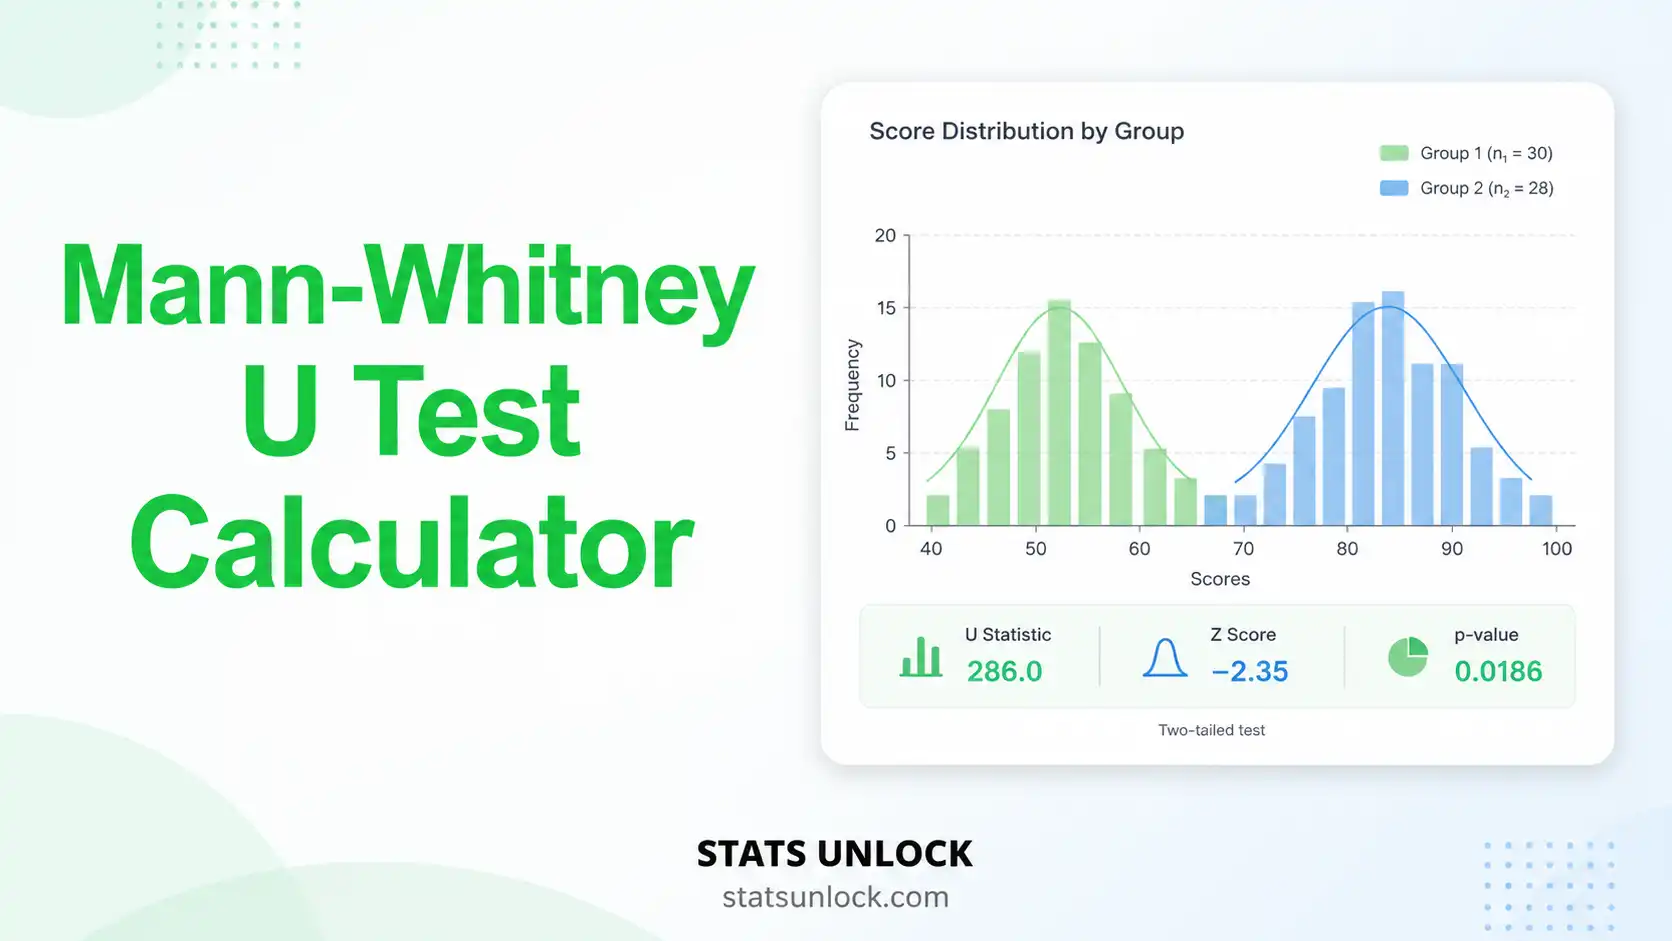
Mann-Whitney U Test Calculator
Free online Mann-Whitney U test calculator for comparing two independent groups when your data are not normally distributed. Get the U statistic, Z-score, exact and asymptotic p-values, effect size r, ranks, charts, and APA-format results — instantly.
📝 Step 1 — Enter Your Data
Type values directly into the cells. Use "Add Row" to extend.
| Placebo |
|---|
| Treatment |
|---|
⚙️ Step 2 — Test Configuration
💡 Detailed Interpretation Results & How to Write Your Results
Interpretation of Your Mann-Whitney U Test Results
How to Write Your Results in Research (5 Examples)
▶ Run the analysis above to auto-fill all five reporting examples with your results.
🧮 Technical Notes and Formulas
Sub-section A — Formulas Used
The Mann-Whitney U test ranks all observations from both groups combined and compares the rank sums.
Sub-section B — Technical Notes
- Independence: Each observation must be from a different subject — no repeated measures.
- Scale: Outcome must be at least ordinal so ranks are meaningful.
- Equal-shape assumption: The test compares medians only when both group distributions have similar shapes; otherwise it tests for general distributional differences (stochastic dominance).
- Tie correction: When multiple observations share the same value, the variance σ_U is reduced — this calculator applies the tie correction automatically.
- Continuity correction: Adds ±0.5 to U before computing Z to better approximate the discrete sampling distribution; recommended for moderate samples.
- Exact vs asymptotic p-value: Exact recommended for n ≤ 20 per group; the normal approximation is used for larger samples.
- Alternative tests: If both groups are normal, prefer the independent-samples t-test (more power). If groups are paired, use the Wilcoxon Signed-Rank Test. If three or more groups, use Kruskal-Wallis H.
🎯 When to Use the Mann-Whitney U Test
This free Mann-Whitney U test tool is designed for researchers, students, and data analysts who need to compare two independent groups when parametric assumptions (normality, equal variances) are not met. It is the most widely used non-parametric alternative to the independent-samples t-test.
Decision Checklist
- ✓ You have two independent groups (different subjects in each).
- ✓ Your dependent variable is ordinal or continuous.
- ✓ Data are not normally distributed, or your sample size is small (n < 30).
- ✓ You want to compare medians or rank distributions, not means.
- ✗ Do NOT use if groups are paired/matched → use the Wilcoxon Signed-Rank Test.
- ✗ Do NOT use for three or more groups → use the Kruskal-Wallis H Test.
- ✗ Do NOT use for nominal categorical outcomes → use Chi-Square or Fisher's Exact.
Real-World Examples
🏥 Medical Research
Comparing pain scores (1–10 ordinal scale) between a placebo group and a drug-treatment group.
📚 Education
Comparing exam scores between students taught by traditional lecture vs flipped-classroom methods.
🧠 Psychology
Comparing self-reported anxiety ratings between two demographic groups when scores are skewed.
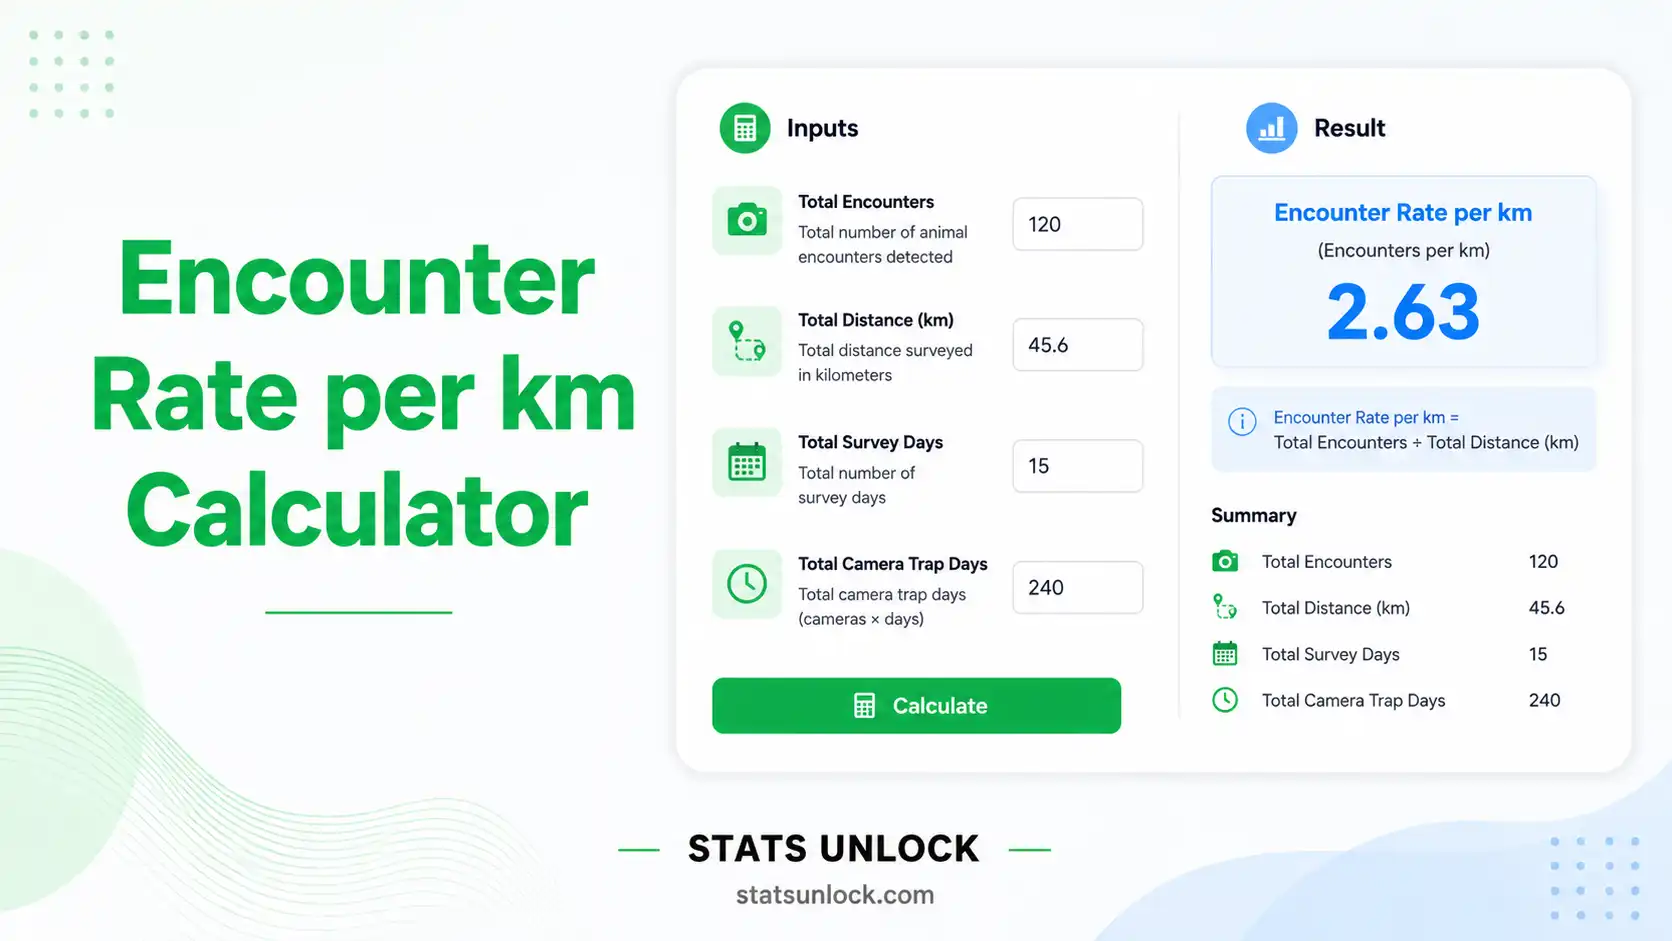
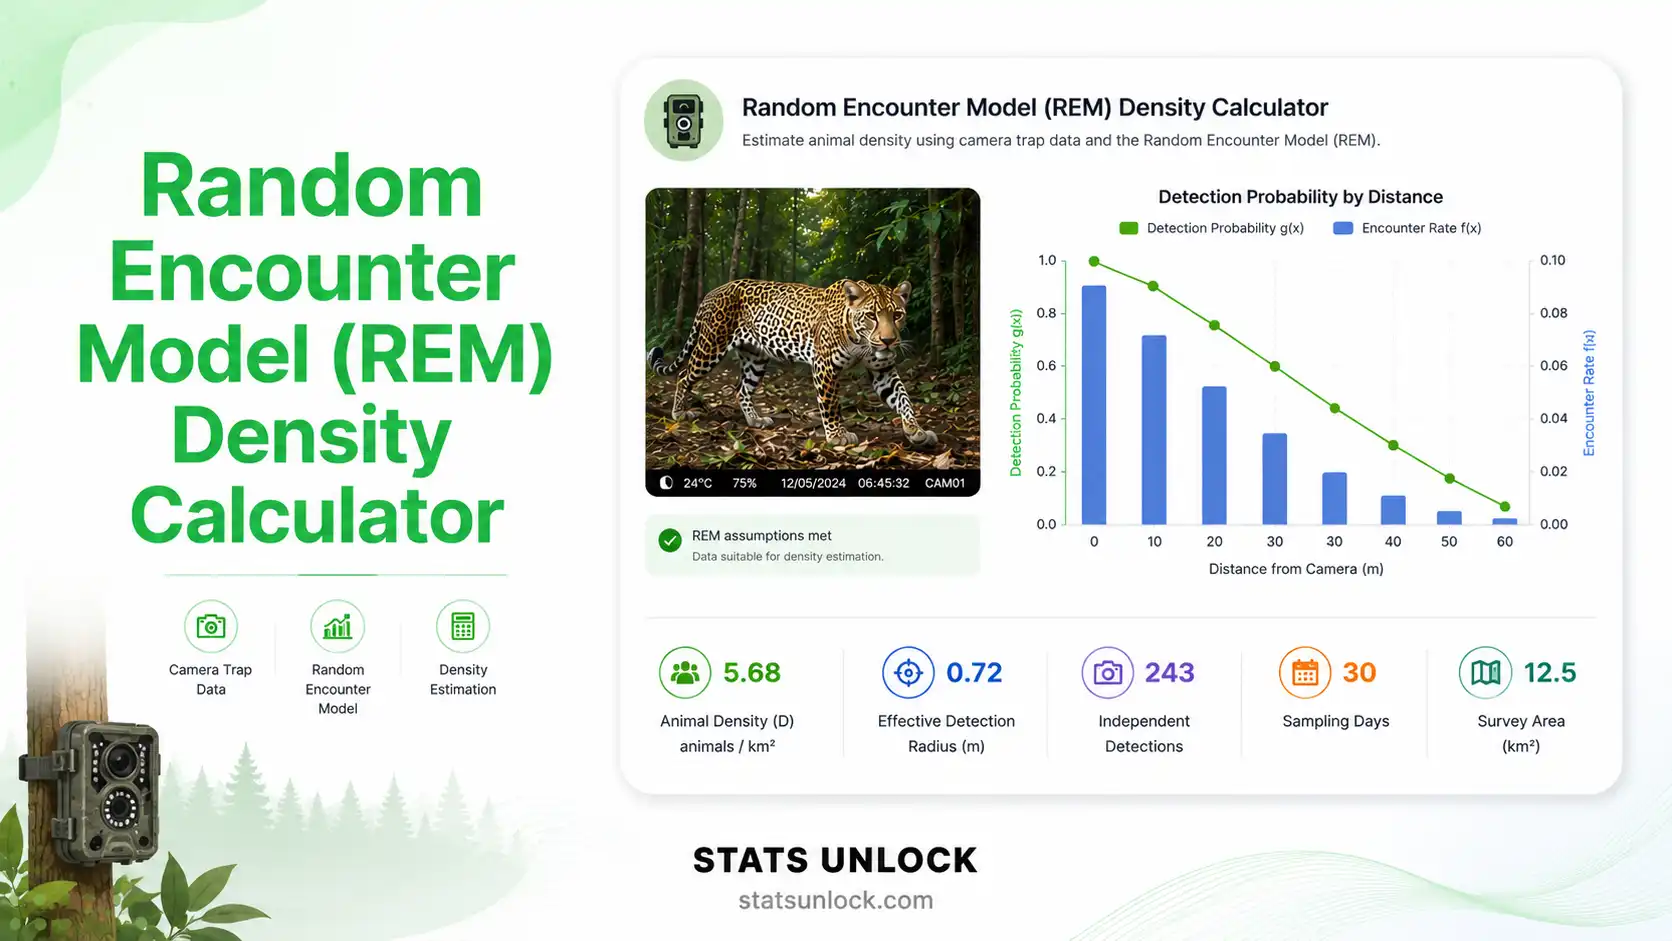
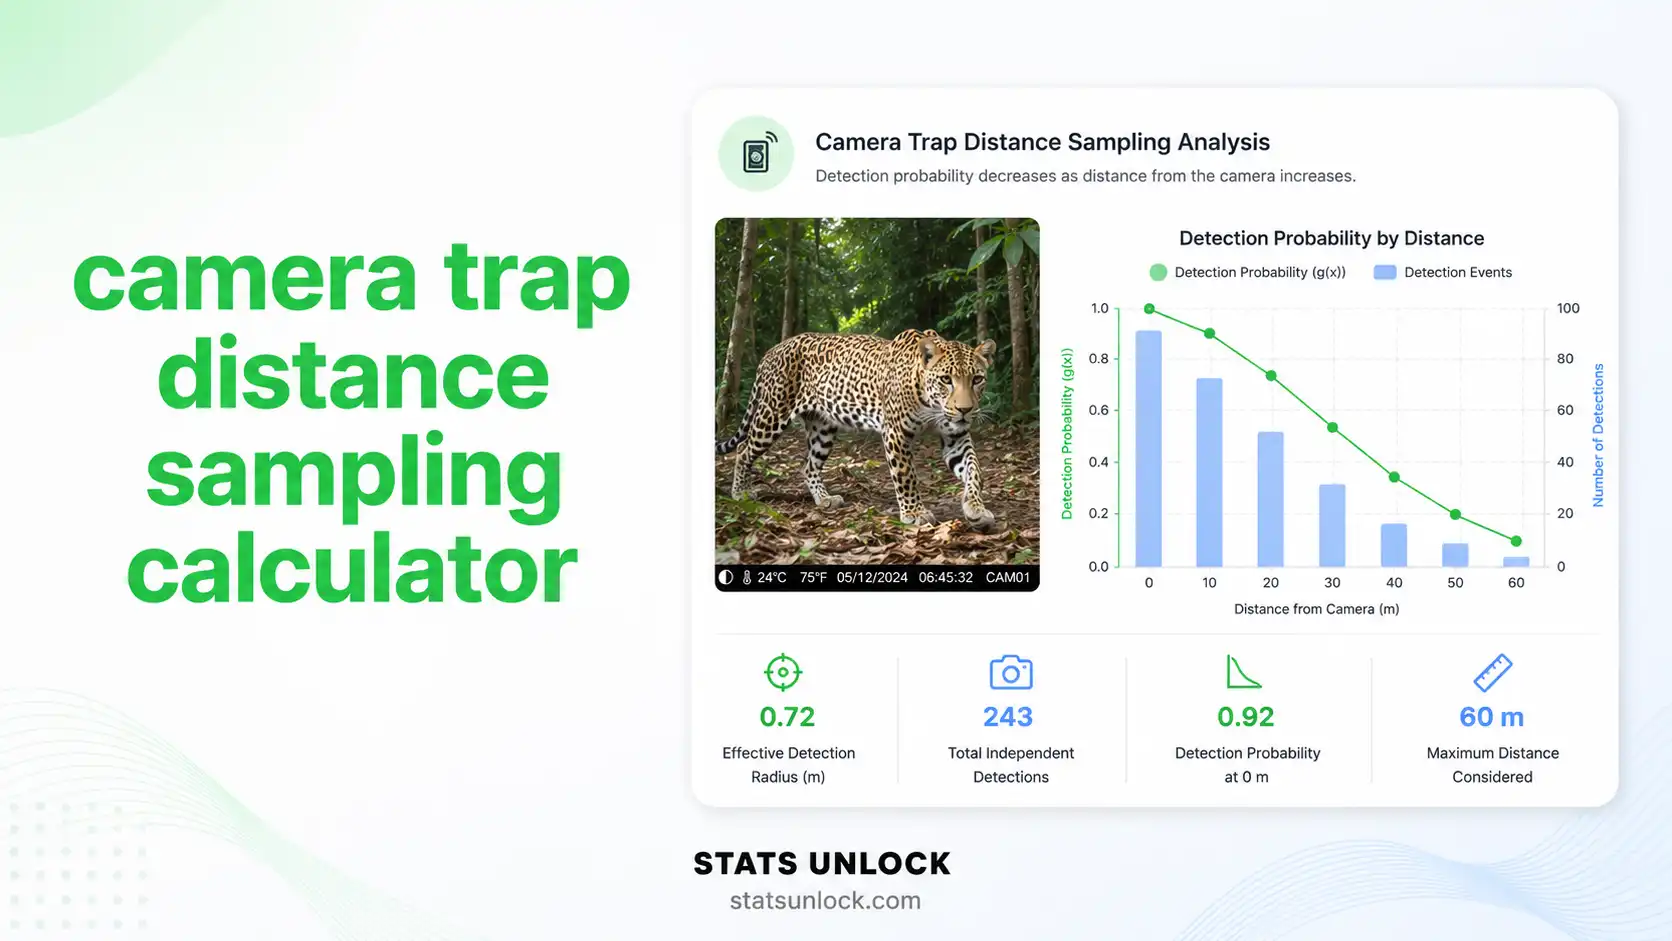
🌳 Wildlife Ecology
Comparing camera-trap detection rates of a target species between two forest reserves.
💼 Business / Marketing
Comparing customer satisfaction ratings (1–5 stars) between two product brands.
🌱 Agriculture
Comparing crop yield ranks between two fertilizer treatments where yield varies non-normally.
Sample Size Guidance
- Minimum: 5 observations per group for the normal approximation to be reasonable.
- Recommended: 15–20 per group for reliable inference.
- For medium effect (r = 0.30), α = 0.05, 80% power: approximately 70 participants total (35 per group).
- Use the exact distribution when n ≤ 20 per group; the asymptotic Z is fine above that.
Decision Tree — Related Tests
📖 How to Use This Mann-Whitney U Test Calculator
- STEP 1 — Enter Your Data Use the Paste tab (comma-separated, e.g., 52, 48, 55, 61, 47), the Upload tab (CSV/Excel), or the Manual table. Edit the group names directly in the small green-bordered input above each box.Example: Group 1 "Placebo" = 52, 48, 55, 61, 47; Group 2 "Treatment" = 38, 41, 35, 44, 39.
- STEP 2 — Choose a Sample Dataset Pick from the 5 built-in datasets (medical, education, ecology, business, neuroscience) to immediately see the calculator in action.
- STEP 3 — Configure Test Settings Set α (default 0.05), tail type (two-tailed by default), continuity correction (recommended), and p-value method (auto picks exact for small samples).
- STEP 4 — Run the Analysis Click the green "🚀 Run Mann-Whitney U Test" button. Results render instantly.
- STEP 5 — Read the Summary Cards The four colored cards show U, Z, p-value (green = significant, red = not), and effect size r at a glance.Example: U = 18.5, Z = -2.04, p = .041, r = .46 (medium-to-large).
- STEP 6 — Read the Full Results Table Every statistic — n₁, n₂, rank sums, medians, U₁, U₂, Z (corrected/uncorrected), p-values, effect sizes — is explained in the right column.
- STEP 7 — Examine Both Visualizations The box plot shows medians, IQR, and outliers; the rank distribution chart shows where each group sits on the combined rank ladder.
- STEP 8 — Check Assumptions Green/yellow/red badges flag independence, scale, equal-shape, tie density, and minimum sample size. Yellow = caution; red = consider an alternative test.
- STEP 9 — Read the Detailed Interpretation Five plain-language paragraphs translate the numbers, plus five copy-ready reporting templates (APA, Thesis, Plain-Language, Abstract, Pre-Registration) auto-fill with your stats.
- STEP 10 — Export Your Results Download Doc (.txt) for plain-text archives; Download PDF for a print-ready report; Copy Summary for instant clipboard pasting into emails or chat.
❓ Frequently Asked Questions
Q1. What is the Mann-Whitney U test and when should I use it?
The Mann-Whitney U test is a non-parametric test that compares the rank distributions of two independent groups. It is the rank-based equivalent of the independent-samples t-test. Use it when your outcome is ordinal, your data are not normally distributed, or your samples are small.
Real-world example: A pharmacologist compares pain scores (rated 1–10) between a placebo group and a drug-treatment group. Because the scores are ordinal and skewed, the Mann-Whitney U test is the appropriate choice.
Q2. What is a p-value, and how do I interpret it for the Mann-Whitney U test?
The p-value is the probability of observing a U statistic at least as extreme as the one calculated, assuming both groups come from the same underlying distribution.
A p-value of 0.03 means there is a 3% chance of seeing this result if the two groups were truly identical. The p-value is NOT the probability that the null hypothesis is true. If p < α (typically 0.05), reject the null and conclude the groups differ.
Q3. What does statistical significance mean — and does it equal practical importance?
Statistical significance means the result is unlikely under the null hypothesis. It does NOT automatically mean the result is important. Large samples can produce tiny p-values for trivially small differences.
Always report the effect size r alongside the p-value. A statistically significant result with r = 0.05 is probably not practically meaningful; a non-significant result with r = 0.40 in a small sample probably deserves a larger replication study.
Q4. What is the effect size r and how do I interpret it?
The effect size r for the Mann-Whitney U test is computed as |Z| ÷ √N, where N is the total sample size. It is interpretable like Pearson's r.
Cohen's (1988) benchmarks: r ≈ 0.10 = small effect (groups differ slightly), r ≈ 0.30 = medium effect (a noticeable difference visible in plots), r ≈ 0.50 = large effect (groups are very clearly separated).
Q5. What assumptions does the Mann-Whitney U test require?
Required assumptions:
• Independence — observations within and between groups are independent.
• Ordinal or continuous outcome — values must be rankable.
• Random sampling — both groups drawn independently from their populations.
• Equal-shape assumption — only required if you want to interpret the result as a comparison of medians; otherwise the test detects general stochastic differences.
If groups are paired, switch to Wilcoxon Signed-Rank. If three or more groups, switch to Kruskal-Wallis H.
Q6. How large a sample do I need for the Mann-Whitney U test to be reliable?
Minimum: 5 observations per group for the normal approximation to behave reasonably. Recommended: 15–20 per group for solid inference.
For 80% power to detect a medium effect (r ≈ 0.30) at α = 0.05 (two-tailed), you need approximately 70 participants total (35 per group). Very small samples (n < 5 per group) make the test unreliable even if p is below 0.05.
Q7. What is the difference between one-tailed and two-tailed Mann-Whitney U tests?
A two-tailed test detects differences in either direction (Group 1 ≠ Group 2). A one-tailed test only detects differences in a pre-specified direction (Group 1 < Group 2 or Group 1 > Group 2) and is more powerful for detecting that direction.
Default to two-tailed unless you have a strong, theory-driven hypothesis about the direction stated before data collection. Switching to one-tailed after seeing the data inflates Type I error.
Q8. How do I report Mann-Whitney U test results in APA 7th edition format?
Report the U statistic, both sample sizes, the Z-score (when using the normal approximation), the exact p-value, and the effect size r.
Example sentence: "A Mann-Whitney U test indicated that pain scores were significantly lower in the treatment group (Mdn = 3) than the placebo group (Mdn = 6), U = 18.5, Z = -2.04, p = .041, r = .46."
See Section 2.7 above for five complete reporting templates.
Q9. Can I use this calculator for my published research or university assignment?
Yes — this Mann-Whitney U test calculator is designed for educational use, exploratory analysis, and homework. For formal research publications, verify the result with peer-reviewed software (R's wilcox.test(), Python's scipy.stats.mannwhitneyu(), or SPSS).
Citation: Stats Unlock. (2025). Mann-Whitney U test calculator. Retrieved from https://statsunlock.com/mann-whitney-u-test-calculator
Q10. What should I do if my Mann-Whitney U test result is not significant?
A non-significant result (p > α) does NOT prove the two groups are identical. It only means the data do not provide enough evidence to reject the null hypothesis.
Check three things: (1) statistical power — was your sample large enough to detect a meaningful effect? (2) effect size — is r small (real null) or moderate (under-powered)? (3) consider a Bayesian alternative, which can quantify evidence for the null.
🏁 Conclusion — Putting the Mann-Whitney U Test to Work
The Mann-Whitney U test is one of the most useful tools in the non-parametric toolkit. Whenever you have two independent groups and the assumption of normality is in doubt — whether because your sample is small, your outcome is ordinal, or your distribution is skewed — this test gives you a robust, defensible way to ask "Do these two groups really differ?" without being misled by a few extreme observations or a non-bell-shaped histogram.
Unlike the independent t-test, the Mann-Whitney U test does not compare means; it compares the distribution of ranks. That subtle distinction has a powerful implication: the test is sensitive to differences anywhere in the distribution — central tendency, location, even shape. When the two distributions have similar spread and shape, the test functions as a comparison of medians; when they differ in shape, it tests the broader hypothesis that one group tends to produce larger values than the other (stochastic dominance).
To use this calculator effectively in real research, follow a clear three-step workflow: (1) verify the assumptions using the Assumption Checks panel — pay particular attention to the independence and equal-shape badges; (2) read the full results table instead of fixating on the p-value alone — the U statistic, Z-score, rank sums, and effect size r tell a far richer story than any single number; and (3) report both significance and magnitude using the auto-filled APA template — peer reviewers and journal editors increasingly demand effect sizes alongside p-values, and this tool produces both.
One important interpretive nuance: a "statistically significant" Mann-Whitney result (p < .05) is not automatically a "scientifically important" result. Large samples produce small p-values for tiny differences. The effect size r anchors the result in practical magnitude — a value below 0.10 is trivial regardless of significance, while values above 0.30 indicate a difference visible to the naked eye in plots. Always report both and interpret them together.
Finally, the Mann-Whitney U test sits inside a broader family of rank-based methods. If your study has paired or repeated measures, switch to the Wilcoxon Signed-Rank test. If you have three or more independent groups, use the Kruskal-Wallis H test. If your outcome is binary, use Chi-Square or Fisher's Exact. The decision tree in Section 2.10 maps these alternatives in one glance.
📌 Key Takeaways
- Use it when — two independent groups, ordinal or non-normal continuous outcome, small or moderate sample size.
- Report — U statistic, n₁, n₂, Z (with continuity correction), exact p-value, and effect size r.
- Interpret — significance answers "is there a difference?"; effect size r answers "how big is it?".
- Verify — replicate in R (
wilcox.test) or Python (scipy.stats.mannwhitneyu) before publication. - Switch tests — paired data → Wilcoxon Signed-Rank; 3+ groups → Kruskal-Wallis; normal data → independent t-test.
📚 References
The following references support the statistical methods used in this Mann-Whitney U test calculator, covering effect size interpretation, p-value reporting, and best practices in hypothesis testing for non-parametric two-sample comparisons.
- Mann, H. B., & Whitney, D. R. (1947). On a test of whether one of two random variables is stochastically larger than the other. Annals of Mathematical Statistics, 18(1), 50–60. https://doi.org/10.1214/aoms/1177730491
- Wilcoxon, F. (1945). Individual comparisons by ranking methods. Biometrics Bulletin, 1(6), 80–83. https://doi.org/10.2307/3001968
- Cohen, J. (1988). Statistical power analysis for the behavioral sciences (2nd ed.). Lawrence Erlbaum Associates.
- Rosenthal, R. (1991). Meta-analytic procedures for social research (Rev. ed.). SAGE Publications. https://doi.org/10.4135/9781412984997
- Field, A. (2018). Discovering statistics using IBM SPSS statistics (5th ed.). SAGE Publications.
- Conover, W. J. (1999). Practical nonparametric statistics (3rd ed.). Wiley.
- Hollander, M., Wolfe, D. A., & Chicken, E. (2014). Nonparametric statistical methods (3rd ed.). Wiley. https://doi.org/10.1002/9781119196037
- Fritz, C. O., Morris, P. E., & Richler, J. J. (2012). Effect size estimates: Current use, calculations, and interpretation. Journal of Experimental Psychology: General, 141(1), 2–18. https://doi.org/10.1037/a0024338
- Ruxton, G. D. (2006). The unequal variance t-test is an underused alternative to Student's t-test and the Mann-Whitney U test. Behavioral Ecology, 17(4), 688–690. https://doi.org/10.1093/beheco/ark016
- Divine, G. W., Norton, H. J., Barón, A. E., & Juarez-Colunga, E. (2018). The Wilcoxon-Mann-Whitney procedure fails as a test of medians. The American Statistician, 72(3), 278–286. https://doi.org/10.1080/00031305.2017.1305291
- American Psychological Association. (2020). Publication manual of the American Psychological Association (7th ed.). APA. https://doi.org/10.1037/0000165-000
- R Core Team. (2024). R: A language and environment for statistical computing. R Foundation for Statistical Computing. https://www.R-project.org/
- Virtanen, P., Gommers, R., Oliphant, T. E., et al. (2020). SciPy 1.0: Fundamental algorithms for scientific computing in Python. Nature Methods, 17, 261–272. https://doi.org/10.1038/s41592-020-0772-5
- NIST/SEMATECH. (2013). e-Handbook of Statistical Methods. National Institute of Standards and Technology. https://www.itl.nist.gov/div898/handbook/
- Lehmann, E. L. (2006). Nonparametrics: Statistical methods based on ranks (Rev. ed.). Springer. https://doi.org/10.1007/978-0-387-35212-1