


Overview
Data Summary
Results
Interpretation
APA Reporting
Assumptions
Quartile computation requires only ordinal or continuous data. No distributional assumptions are required. For reliable Q1 and Q3 estimation, n ≥ 8 is recommended.
References
Tukey, J. W. (1977). Exploratory Data Analysis. Addison-Wesley. | Hyndman, R. J., & Fan, Y. (1996). The American Statistician, 50(4), 361–365.
Generated by STATS UNLOCK — statsunlock.com
Quartile Calculator — Q₁, Q₂, Q₃
Instantly compute Q1, Q2 (median), Q3, IQR, quartile deviation, Tukey fences, and outlier detection — with interactive box plot and violin chart, plus downloadable reports.
✓ Q1 · Q2 · Q3
✓ IQR & Fences
✓ Box Plot
✓ Violin Chart
✓ CSV / Excel Upload
✓ Free & Instant
📥 Enter Your Data
Enter your data above.
Supports .csv, .txt, .xlsx, .xls — headers detected automatically.
No values added yet.
✅ When to Use Quartiles
Use quartiles when…
- Your data is skewed and you need a robust measure of centre (Q2) and spread (IQR).
- You want to detect outliers without assuming a normal distribution (Tukey fences).
- You are building box plots or five-number summary tables for descriptive statistics.
- You need to rank or group observations (e.g., bottom 25%, middle 50%, top 25%).
- You are comparing the variability of different datasets on different scales (coefficient of QD).
- You are analysing income, test scores, ecological measurements, or clinical data.
Quick Decision Guide
Data skewed?→ Use Q2 (median) instead of mean; report IQR instead of SD.
Need outlier bounds?→ Apply Tukey fences: [Q1−1.5·IQR, Q3+1.5·IQR].
Comparing two groups?→ Report five-number summary + side-by-side box plots.
Need % ranks?→ Use percentiles; Q1=P25, Q2=P50, Q3=P75.
📖 How to Use This Tool
1
Enter data — paste comma or newline-separated numbers, upload a CSV/Excel file, or add values one by one using the Manual tab.
2
Choose a sample dataset — use the dropdown to load one of five built-in examples and explore the results instantly.
3
Select quartile method — pick Inclusive (Moore-McCabe), Exclusive, or Hyndman-Fan Type 7 (R default) from the method selector.
4
Click "Calculate Quartiles" — results appear instantly with Q1, Q2, Q3, IQR, quartile deviation, and Tukey fence outlier boundaries.
5
Read the outlier list — any values outside the Tukey fences are flagged automatically below the results table.
6
Inspect the box plot — the interactive box plot visualises Q1, Q2, Q3, whiskers, and outlier points.
7
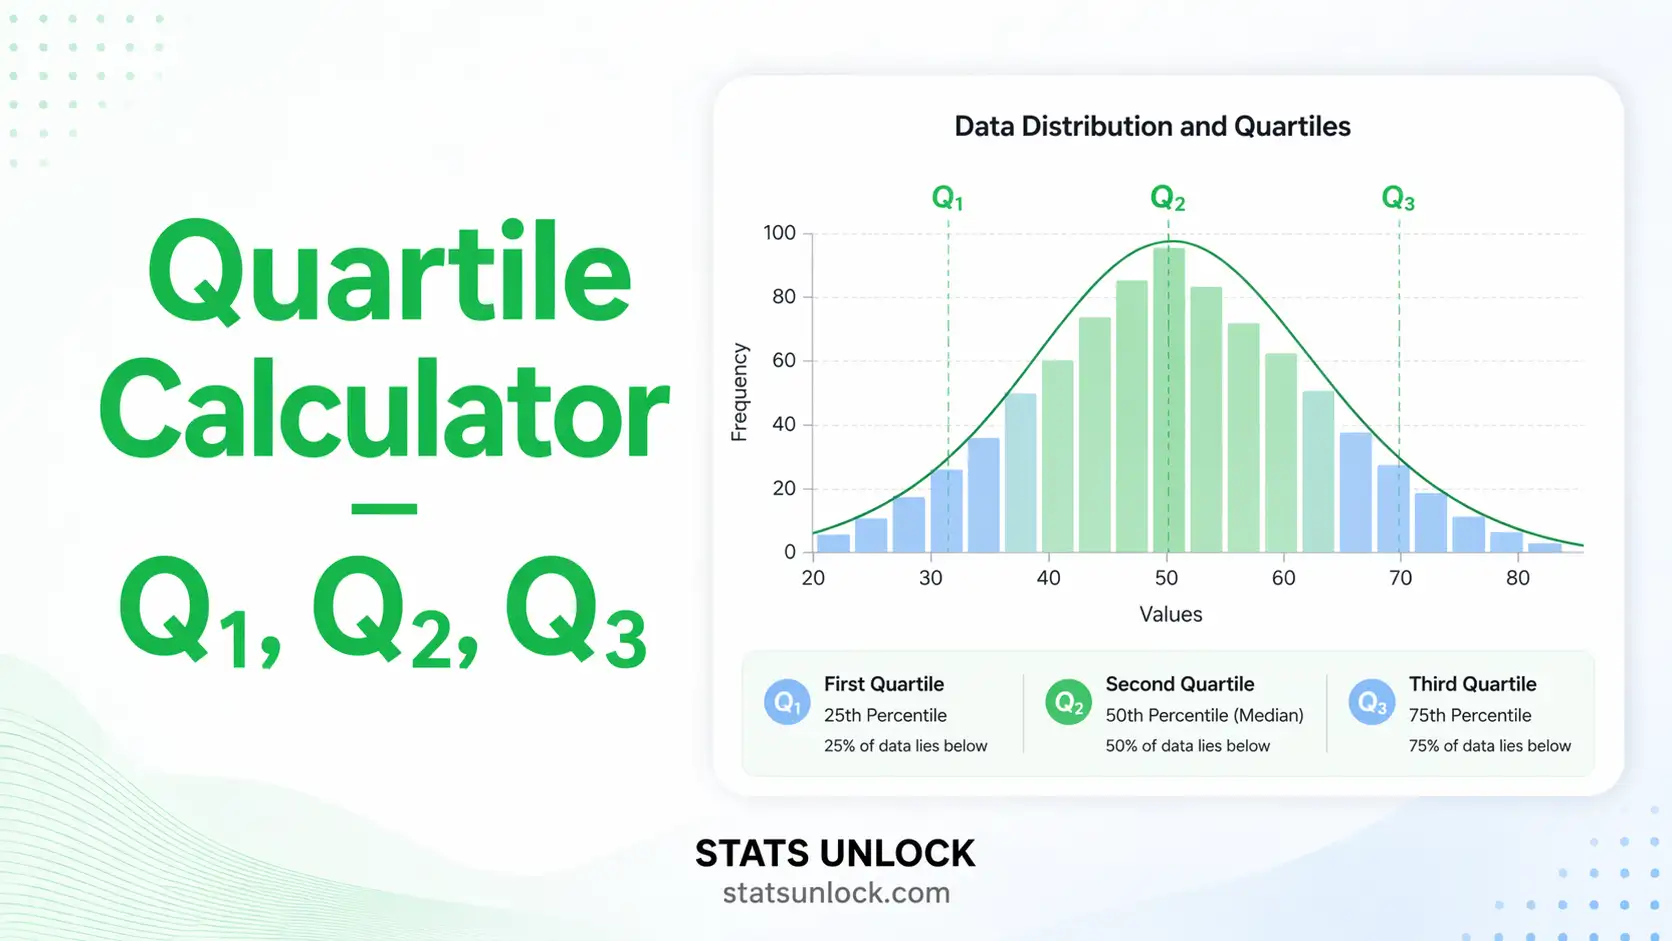
Check the histogram — the distribution chart shows frequency bars with a KDE curve and Q1/Q2/Q3 marker lines.
8
Read the interpretation — dynamic paragraphs explain what the quartile values mean for your specific dataset.
9
Copy the APA write-up — ready-made APA 7th, thesis, and plain-language write-ups with your live values, ready to copy.
10
Download your report — export as .txt Doc, .xlsx Excel, .docx Word (full 8-section report), or print to PDF.
Worked Example: Dataset: 3, 7, 8, 5, 12, 14, 21, 13, 18. Sorted: 3, 5, 7, 8, 12, 13, 14, 18, 21. Q2 = 12. Lower half: 3,5,7,8 → Q1 = (5+7)/2 = 6. Upper half: 13,14,18,21 → Q3 = (14+18)/2 = 16. IQR = 16−6 = 10. Lower fence: 6−15 = −9. Upper fence: 16+15 = 31. No outliers.
❓ Frequently Asked Questions
What is a quartile in statistics?
Quartiles are three cut-points — Q1, Q2, and Q3 — that divide a sorted dataset into four equal parts, each containing exactly 25% of the observations. Q1 is the lower quartile (25th percentile), Q2 is the median (50th percentile), and Q3 is the upper quartile (75th percentile).
How do I calculate Q1, Q2, and Q3 step by step?
1) Sort your values from smallest to largest. 2) Find Q2 as the middle value (or average of two middle values for even n). 3) Q1 is the median of the lower half of data; Q3 is the median of the upper half. Different textbooks use slightly different rules for odd n — this tool lets you choose your preferred method.
What is the difference between Q1 and Q3?
Q1 (first quartile) is the value below which 25% of data fall. Q3 (third quartile) is the value below which 75% fall. Their difference — Q3 minus Q1 — is the Interquartile Range (IQR), a robust measure of statistical dispersion.
What does IQR stand for and how is it calculated?
IQR stands for Interquartile Range. It is calculated as IQR = Q3 − Q1 and represents the spread of the middle 50% of your data. Because it ignores the extreme 25% on each side, it is much more robust to outliers than the full range or standard deviation.
How are outliers detected using quartiles?
The Tukey fence method defines outliers as any value below Q1 − 1.5 × IQR or above Q3 + 1.5 × IQR. Values beyond Q1 − 3 × IQR or Q3 + 3 × IQR are classified as extreme outliers. These boundaries are displayed automatically in the results above.
What is quartile deviation?
Quartile Deviation (QD) = (Q3 − Q1) / 2. It is the semi-interquartile range — half the IQR — and represents the average distance of Q1 and Q3 from the median. The Coefficient of Quartile Deviation = QD / Q2, which allows comparison across datasets with different units.
Can I upload an Excel or CSV file to this calculator?
Yes. Click the "Upload File" tab, select any .csv, .txt, .xlsx, or .xls file, and the tool will automatically detect numeric columns. You can preview the data, select your target column, and run the analysis instantly — no conversion needed.
What is the difference between different quartile methods?
There are multiple valid conventions for computing quartiles. The Inclusive (Moore-McCabe) method, used in many textbooks, includes the median in both halves for even n. The Exclusive method excludes the median from both halves for odd n. Hyndman-Fan Type 7, the R default, uses linear interpolation. Results may differ slightly, especially for small datasets.
What is the difference between a percentile and a quartile?
Percentiles divide data into 100 equal parts; quartiles divide into 4. Q1 equals the 25th percentile, Q2 equals the 50th percentile (median), and Q3 equals the 75th percentile. Quartiles are the most commonly reported percentile markers in descriptive statistics.
Why should I use IQR instead of standard deviation for skewed data?
Standard deviation is calculated from the mean and is therefore strongly affected by extreme values. In skewed distributions, a few large outliers can inflate SD dramatically. IQR is based only on the middle 50% of data, making it a far more robust and informative measure of spread when the distribution is asymmetric or has outliers.
📚 References
The quartile calculator methodology below draws on foundational sources for interquartile range calculation and descriptive statistics.
- Tukey, J. W. (1977). Exploratory data analysis. Addison-Wesley.
- Hyndman, R. J., & Fan, Y. (1996). Sample quantiles in statistical packages. The American Statistician, 50(4), 361–365. https://doi.org/10.2307/2684934
- Moore, D. S., & McCabe, G. P. (2017). Introduction to the practice of statistics (9th ed.). W. H. Freeman.
- Mendenhall, W., & Sincich, T. (2016). Statistics for engineering and the sciences (6th ed.). Pearson.
- Hoaglin, D. C., Mosteller, F., & Tukey, J. W. (Eds.). (1983). Understanding robust and exploratory data analysis. Wiley.
- Wilks, S. S. (1948). Order statistics. Bulletin of the American Mathematical Society, 54(1), 6–50.
- Field, A. (2018). Discovering statistics using IBM SPSS statistics (5th ed.). SAGE.
- Rousseeuw, P. J., & Croux, C. (1993). Alternatives to the median absolute deviation. Journal of the American Statistical Association, 88(424), 1273–1283.
- Seltman, H. J. (2018). Experimental design and analysis. Carnegie Mellon University. https://www.stat.cmu.edu/~hseltman/309/Book/Book.pdf
- Pearson, K. (1895). Contributions to the mathematical theory of evolution. II. Skew variation in homogeneous material. Philosophical Transactions of the Royal Society A, 186, 343–414.
- R Core Team. (2024). R: A language and environment for statistical computing (v4.4). R Foundation. https://www.R-project.org/
- Frigge, M., Hoaglin, D. C., & Iglewicz, B. (1989). Some implementations of the boxplot. The American Statistician, 43(1), 50–54.