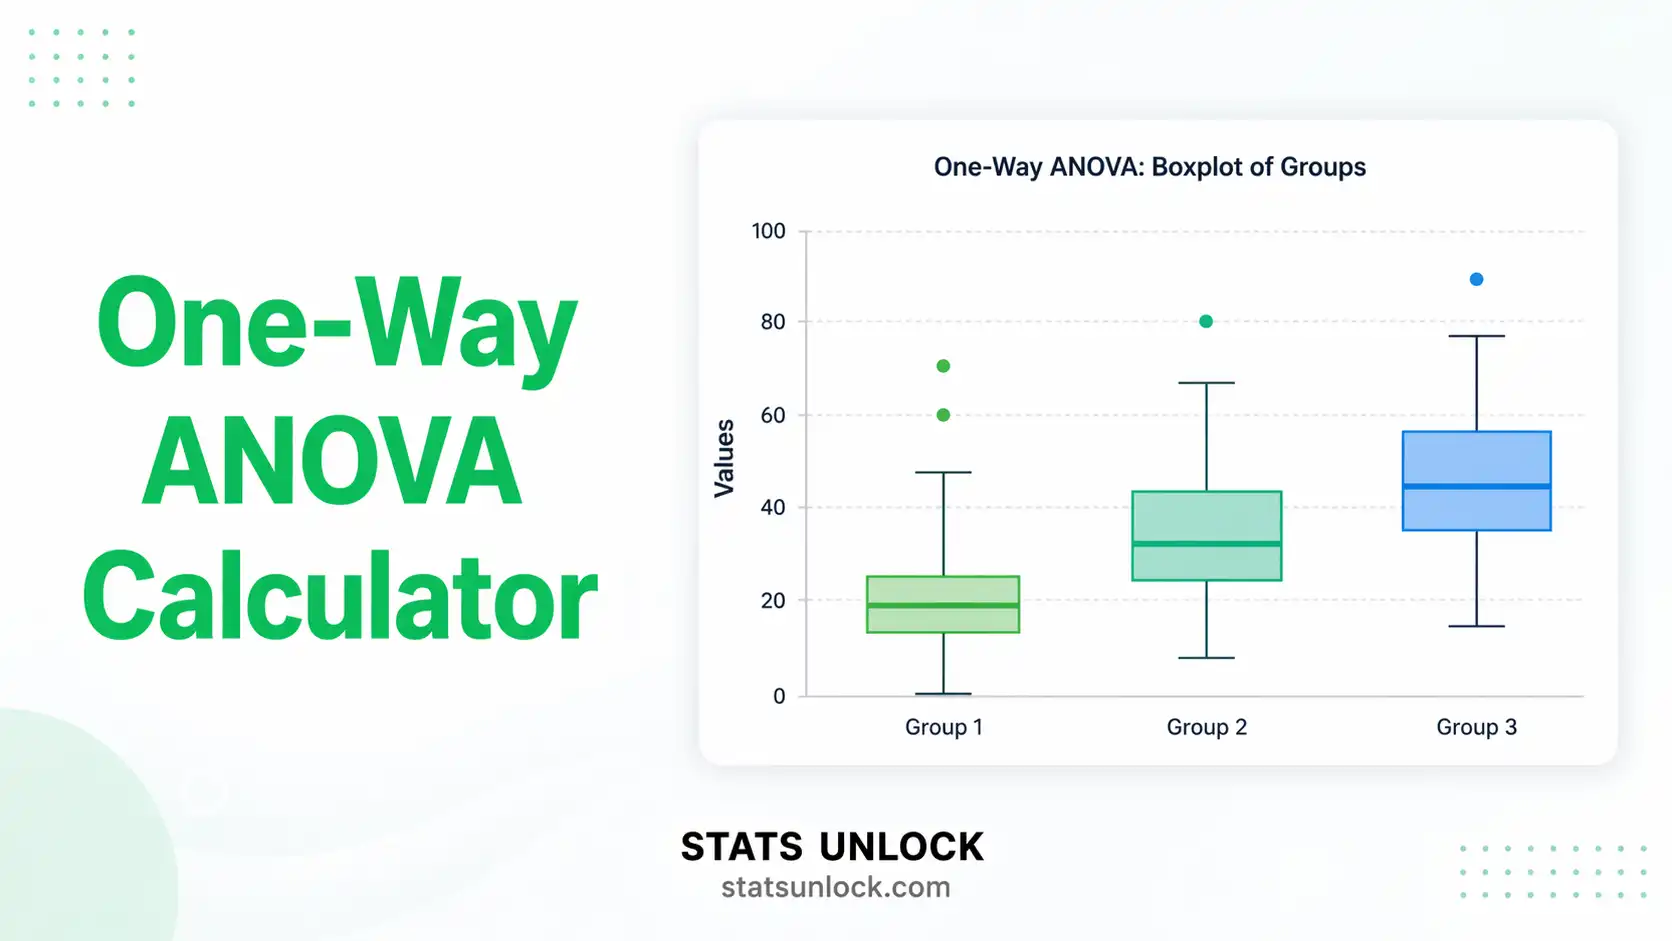
One-Way ANOVA Calculator
Compare means across 3 or more independent groups — F-test, p-value, Tukey HSD post-hoc, η², and four publication-quality charts.
Enter comma-separated values for each group. You can rename the group labels by clicking them. Add up to 8 groups.
Enter values directly in the table cells. Use the row/column buttons to expand the grid.
ANOVA Table
| Source | SS | df | MS | F | p-value |
|---|
Group Descriptive Statistics
| Group | n | Mean | SD | SE | Median | Min | Max | 95% CI |
|---|
Use one-way ANOVA when you want to compare the means of three or more independent groups on a single continuous outcome variable, and you want to test whether group membership explains a significant proportion of variance in that outcome.
🌱 Agriculture: Does fertilizer type (A, B, C) affect crop yield (kg/plot)?
🎓 Education: Do teaching methods (lecture, online, hybrid) differ in exam scores?
💊 Medicine: Does drug dosage level (low, medium, high) affect patient response time (minutes)?
🏢 Business: Do three advertising campaigns produce different average conversion rates?
Decision Tree: 3+ independent groups → continuous DV → normality OK → equal variances → One-Way ANOVA → if significant → Tukey HSD to find which pairs differ. If variances unequal → Welch's ANOVA + Games-Howell. If normality violated → Kruskal-Wallis.
52, 48, 55, 61, 47). You can also upload a CSV/Excel file or use the manual table. Each group should contain all values for that condition.Q1. What is one-way ANOVA and when should I use it?
One-way ANOVA (Analysis of Variance) is a parametric hypothesis test that compares the means of three or more independent groups to determine whether at least one group mean is significantly different from the others. Use it when you have one categorical independent variable with 3+ levels and one continuous dependent variable. Example: Does fertilizer type (A, B, C) significantly affect crop yield? ANOVA answers this without inflating Type I error the way multiple t-tests would.
Q2. What is the p-value in ANOVA, and how do I read it?
The p-value is the probability of obtaining an F-statistic as large as — or larger than — the one observed, if all group population means are truly equal (i.e., if the null hypothesis H₀ is true). A p-value below your chosen alpha (typically 0.05) means you reject H₀ and conclude that at least one group mean differs. Note: p does not tell you which groups differ — use post-hoc tests (Tukey HSD) for that. Also note: p is not the probability that H₀ is true.
Q3. What does statistical significance mean versus practical importance?
Statistical significance (p < 0.05) only tells you the result is unlikely to be due to random chance alone. It says nothing about the size or real-world importance of the difference. With very large samples, trivially tiny differences can become statistically significant. This is why you must always report an effect size alongside p. An η² = 0.01 (small effect) in 10,000 participants may be statistically significant but practically irrelevant, while η² = 0.14 (large effect) in a small sample has far more practical weight.
Q4. What is eta-squared (η²) and how do I interpret it?
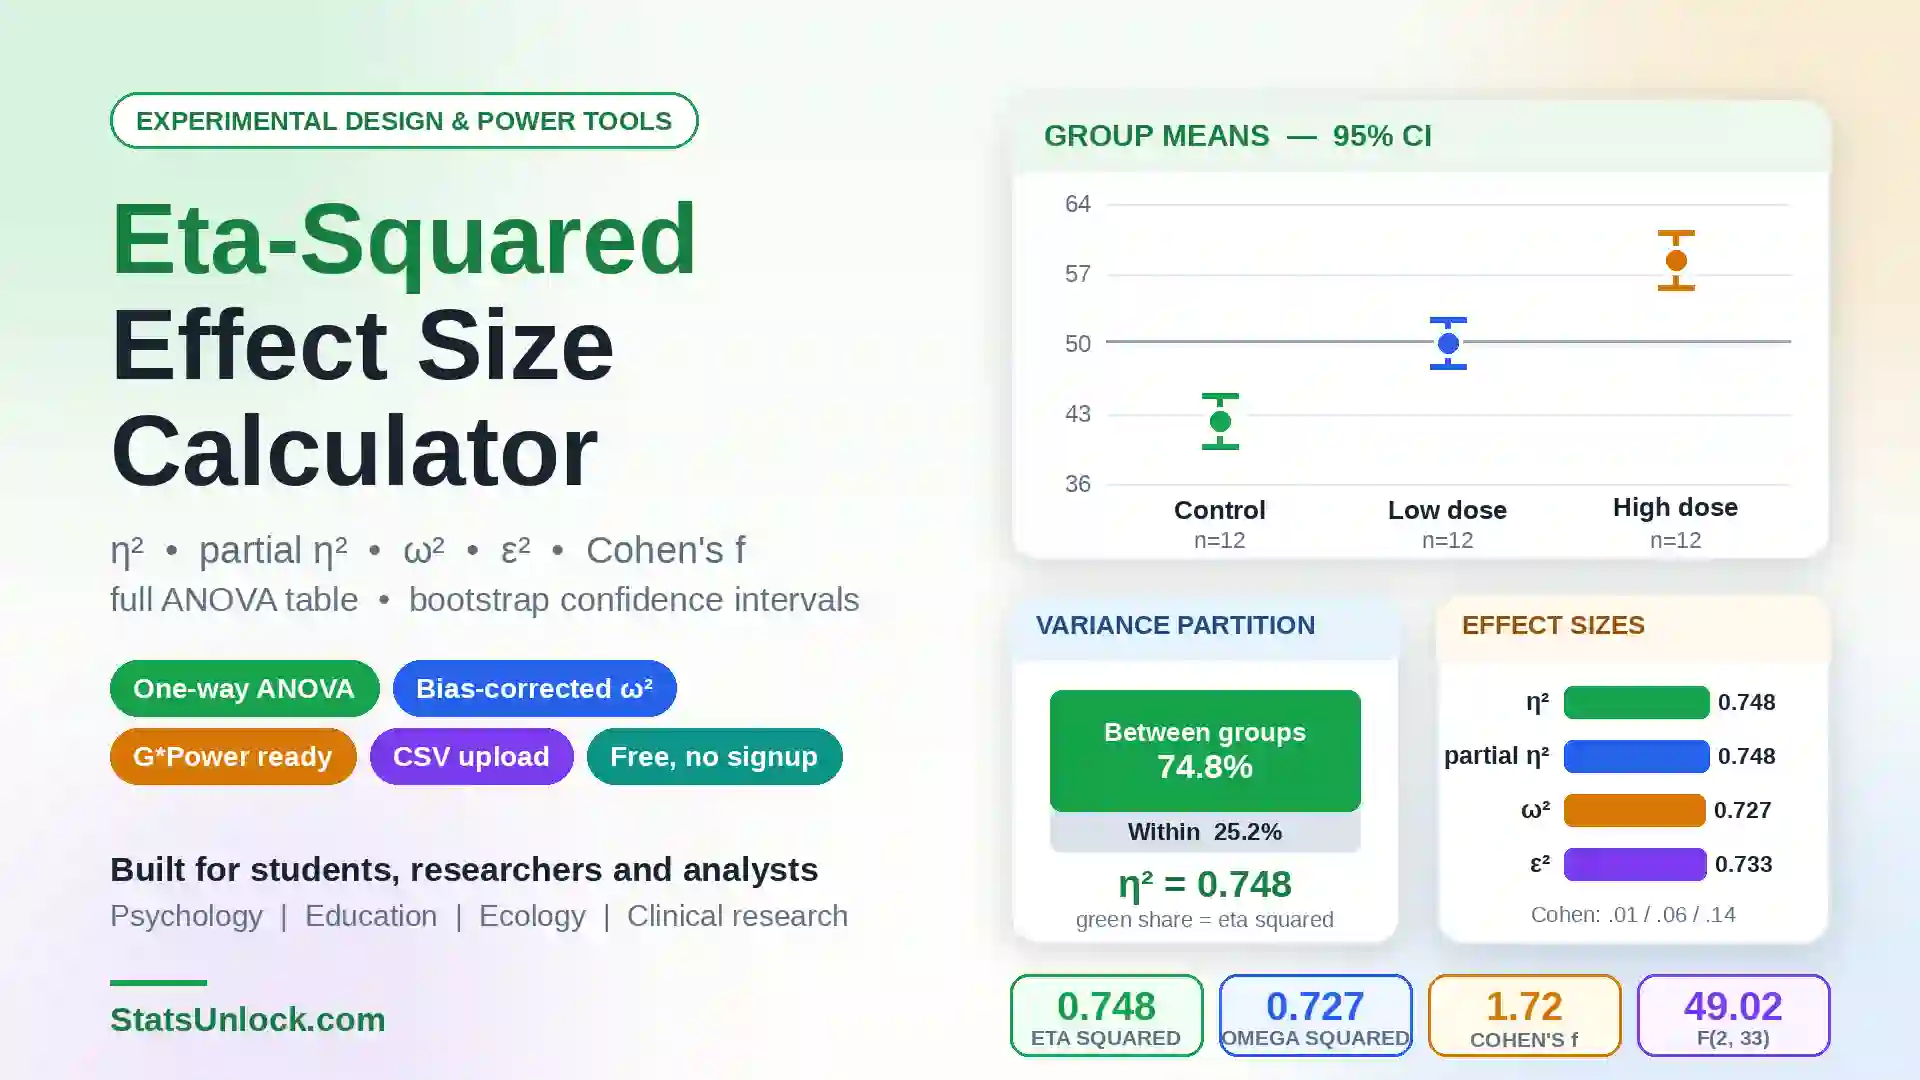
Eta-squared (η²) is the proportion of total variance in the dependent variable that is accounted for by group membership. It ranges from 0 to 1. Cohen's (1988) benchmarks: η² = 0.01 is a small effect, η² = 0.06 is a medium effect, and η² ≥ 0.14 is a large effect. For example, η² = 0.18 means your grouping factor explains 18% of the variance in the outcome — a large, practically meaningful effect. Omega-squared (ω²) is a bias-corrected alternative preferred for small samples.
Q5. What assumptions does one-way ANOVA require, and what if they're violated?
One-way ANOVA assumes: (1) Independence — each observation must be independent of others; (2) Normality — residuals within each group should be approximately normal (check with Shapiro-Wilk test or Q-Q plot; less critical if n ≥ 15 per group); (3) Homogeneity of variances — variances across groups should be roughly equal (check with Levene's test). If normality is violated with small n, use the Kruskal-Wallis H test. If variances are unequal, use Welch's ANOVA with Games-Howell post-hoc.
Q6. How large a sample do I need for reliable ANOVA?
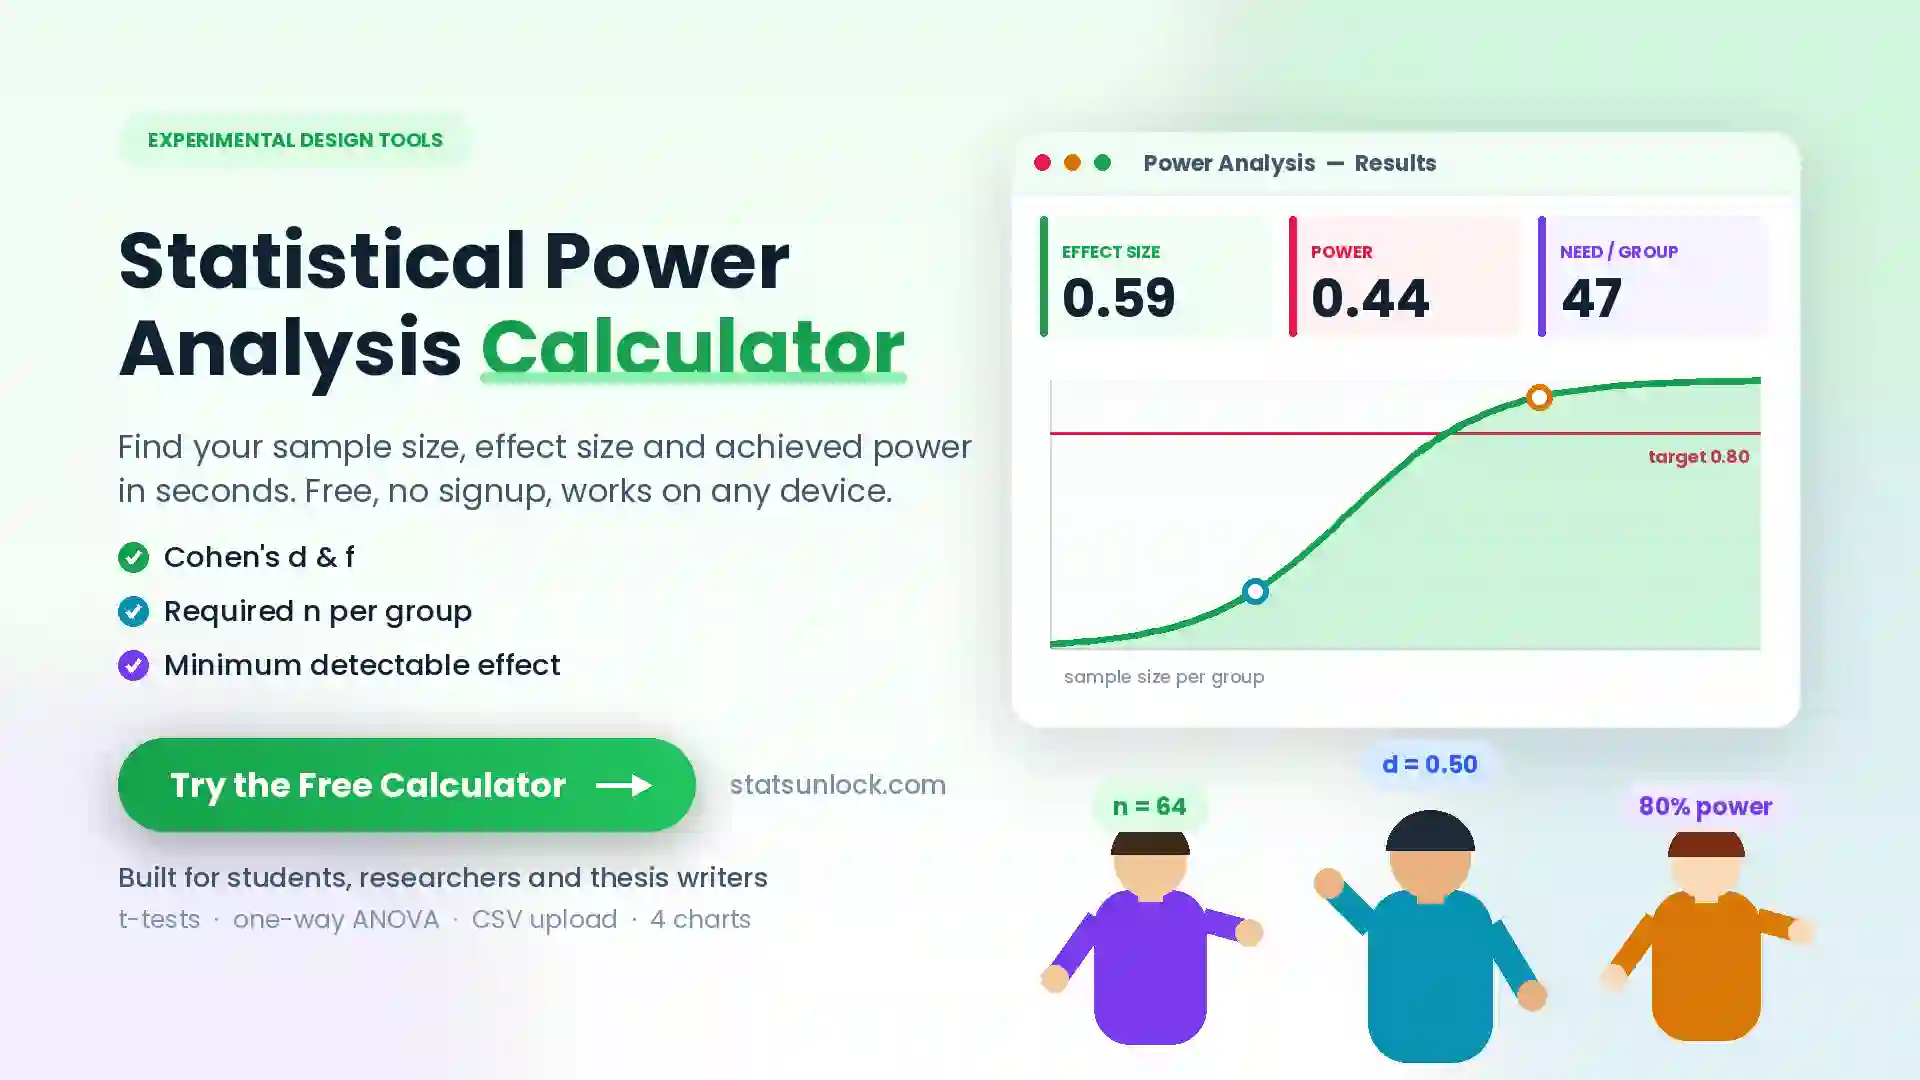
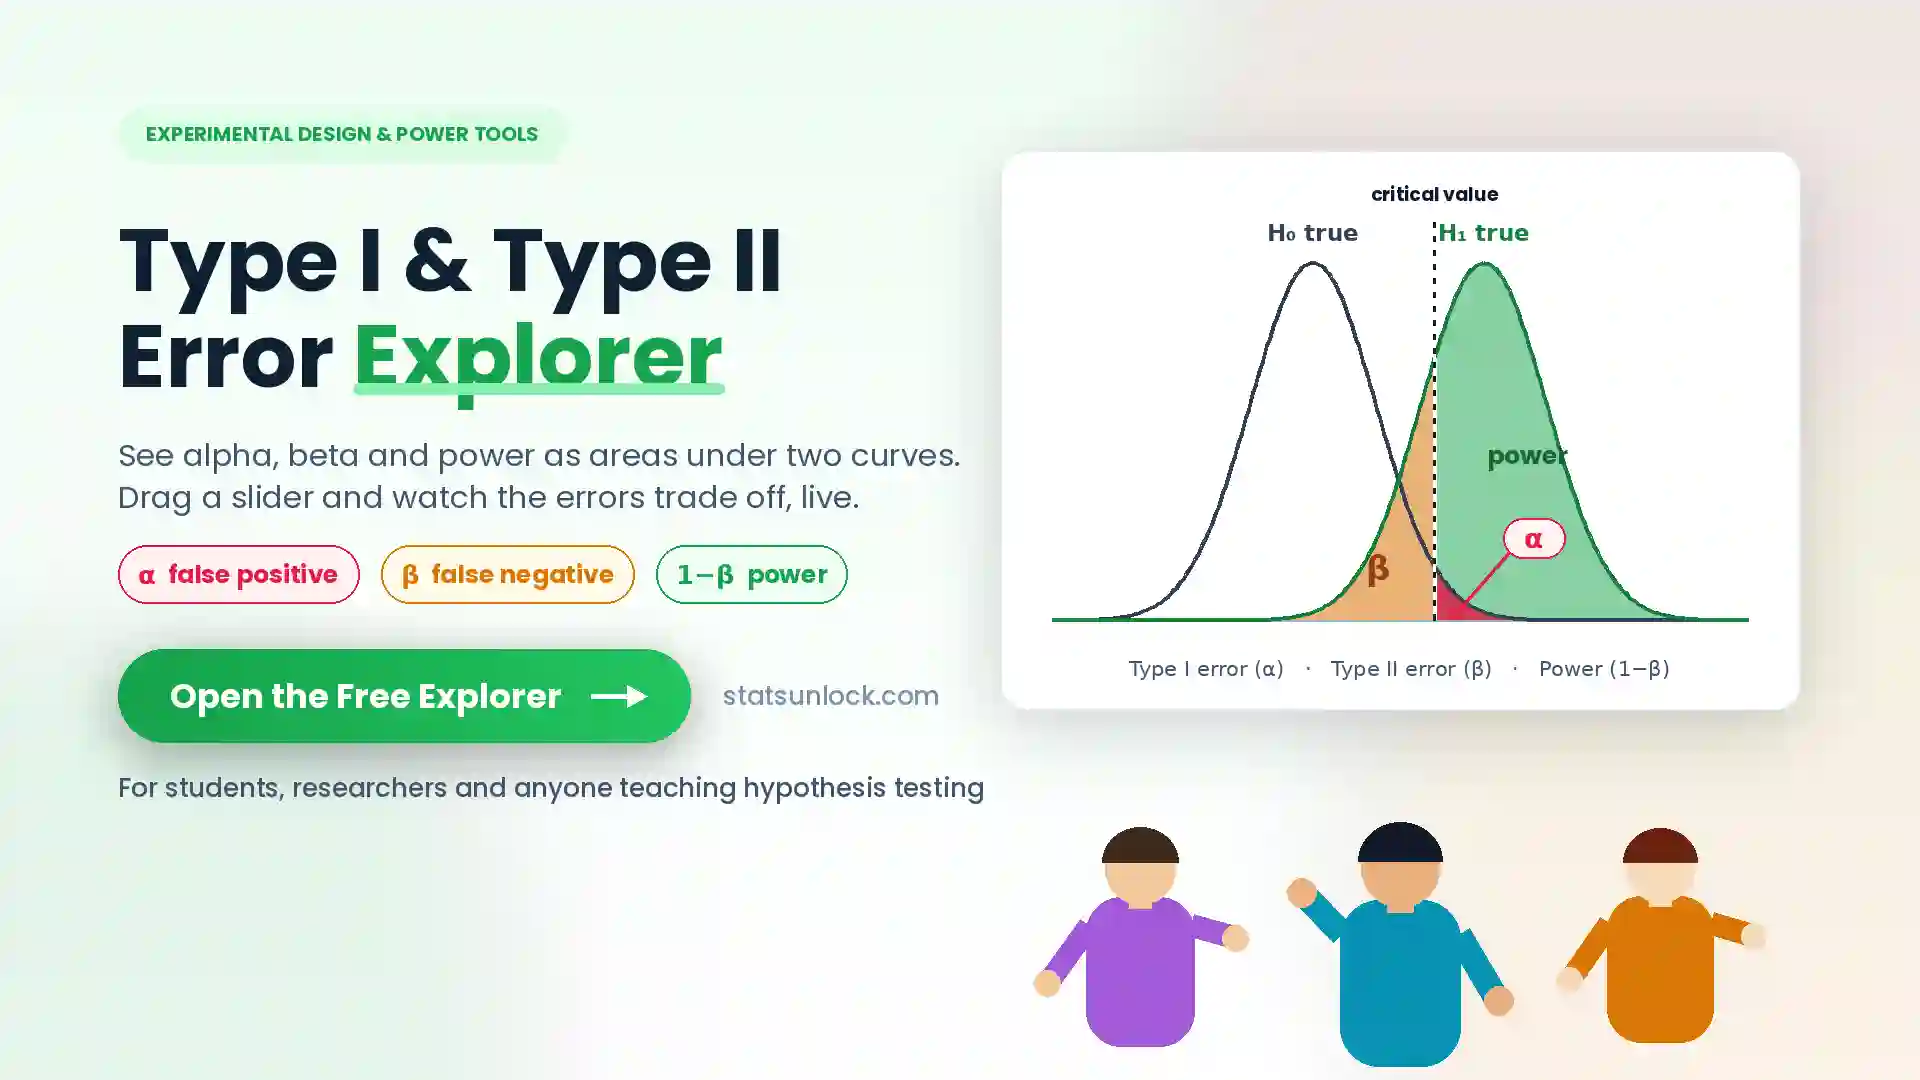
A common rule of thumb is at least 15–20 observations per group. For 80% power to detect a medium effect (Cohen's f = 0.25) at α = 0.05 with 3 groups, you need approximately 52 total observations (~17 per group). For a small effect (f = 0.10), you would need ~200 total. Small groups (n < 10 per group) make ANOVA unreliable and greatly increase the risk of failing to detect a real effect (Type II error). Always plan your sample size with a power analysis before data collection.
Q7. Why do I need post-hoc tests after ANOVA?
The ANOVA F-test is an omnibus test — it tells you only that at least one group mean differs, without specifying which pairs of groups differ. Post-hoc tests like Tukey HSD perform all pairwise comparisons while controlling the family-wise error rate (keeping the overall Type I error at α). Tukey HSD is the most widely recommended post-hoc for equal or roughly equal group sizes. Use Bonferroni for a more conservative correction, or Games-Howell if variances are unequal.
Q8. How do I report one-way ANOVA results in APA 7th edition format?
APA 7th edition format: "A one-way ANOVA was conducted to compare [DV] across [IV] groups. There was a [significant/non-significant] effect of [IV] on [DV], F(dfbetween, dfwithin) = [F], p = [p], η² = [η²]." Always include group means and SDs in a table or in text. Report post-hoc results as: "Tukey HSD post-hoc tests revealed that [Group A] differed significantly from [Group B], p = [p], 95% CI [LL, UL]." See the "How to Write Your Results" section above for five fully auto-filled templates.
Q9. Can I use this calculator for university or published research?
Yes — this tool is designed for educational and exploratory analysis and is suitable for coursework, dissertations, and preliminary research. For peer-reviewed publication, always cross-verify with validated software: aov() + TukeyHSD() in R, scipy.stats.f_oneway() in Python, or SPSS Analyze → Compare Means → One-Way ANOVA. Cite this tool as: STATS UNLOCK. (2025). One-way ANOVA calculator. Retrieved from https://statsunlock.com/tools/one-way-anova-calculator/
Q10. What does a non-significant ANOVA result mean — is my hypothesis wrong?
A non-significant result (p > α) does not prove the null hypothesis is true — it only means your data did not provide sufficient evidence to reject it. Common causes include: (a) insufficient sample size (low power), (b) large within-group variability masking real differences, or (c) the true effect being smaller than expected. Check your power: with n = 10 per group, power for a medium effect may be only 50–60%. Consider running a Bayesian ANOVA (Bayes Factor) to quantify evidence in favour of H₀ rather than simply failing to reject it.
The one-way ANOVA calculator on this page applies methods from peer-reviewed statistical literature on analysis of variance, post-hoc testing, and effect size estimation.
- Fisher, R. A. (1925). Statistical methods for research workers. Oliver and Boyd. Classic foundation of ANOVA
- Cohen, J. (1988). Statistical power analysis for the behavioral sciences (2nd ed.). Lawrence Erlbaum Associates. https://doi.org/10.4324/9780203771587
- Tukey, J. W. (1949). Comparing individual means in the analysis of variance. Biometrics, 5(2), 99–114. https://doi.org/10.2307/3001913
- Levene, H. (1960). Robust tests for equality of variances. In Contributions to probability and statistics (pp. 278–292). Stanford University Press.
- Shapiro, S. S., & Wilk, M. B. (1965). An analysis of variance test for normality (complete samples). Biometrika, 52(3–4), 591–611. https://doi.org/10.2307/2333709
- Kirk, R. E. (1996). Practical significance: A concept whose time has come. Educational and Psychological Measurement, 56(5), 746–759. https://doi.org/10.1177/0013164496056005002
- Olejnik, S., & Algina, J. (2003). Generalized eta and omega squared statistics: Measures of effect size for some common research designs. Psychological Methods, 8(4), 434–447. https://doi.org/10.1037/1082-989X.8.4.434
- Welch, B. L. (1951). On the comparison of several mean values: An alternative approach. Biometrika, 38(3–4), 330–336. https://doi.org/10.2307/2332579
- Maxwell, S. E., & Delaney, H. D. (2004). Designing experiments and analyzing data: A model comparison perspective (2nd ed.). Lawrence Erlbaum. https://doi.org/10.4324/9781410609243
- Field, A. (2018). Discovering statistics using IBM SPSS statistics (5th ed.). SAGE Publications. https://doi.org/10.4135/9781526402264
- American Psychological Association. (2020). Publication manual of the American Psychological Association (7th ed.). APA. https://doi.org/10.1037/0000165-000
- R Core Team. (2024). R: A language and environment for statistical computing. R Foundation for Statistical Computing. https://www.R-project.org/
- Virtanen, P., Gommers, R., Oliphant, T. E., et al. (2020). SciPy 1.0: Fundamental algorithms for scientific computing in Python. Nature Methods, 17, 261–272. https://doi.org/10.1038/s41592-020-0772-5
- NIST/SEMATECH. (2013). e-Handbook of statistical methods. National Institute of Standards and Technology. https://www.itl.nist.gov/div898/handbook/
- Games, P. A., & Howell, J. F. (1976). Pairwise multiple comparison procedures with unequal N's and/or variances: A Monte Carlo study. Journal of Educational Statistics, 1(2), 113–125. https://doi.org/10.3102/10769986001002113