Rényi Entropy Diversity Calculator
Free online generalized entropy calculator for ecology and wildlife research — compute Rényi entropy at any order α, full diversity profile, and Hill-number equivalents from species abundance data.
0 values entered. Format: comma-separated counts (default).
Supports .csv, .txt, .xlsx, .xls — headers detected automatically.
Edit species names and counts. Values automatically populate the analysis on Run.
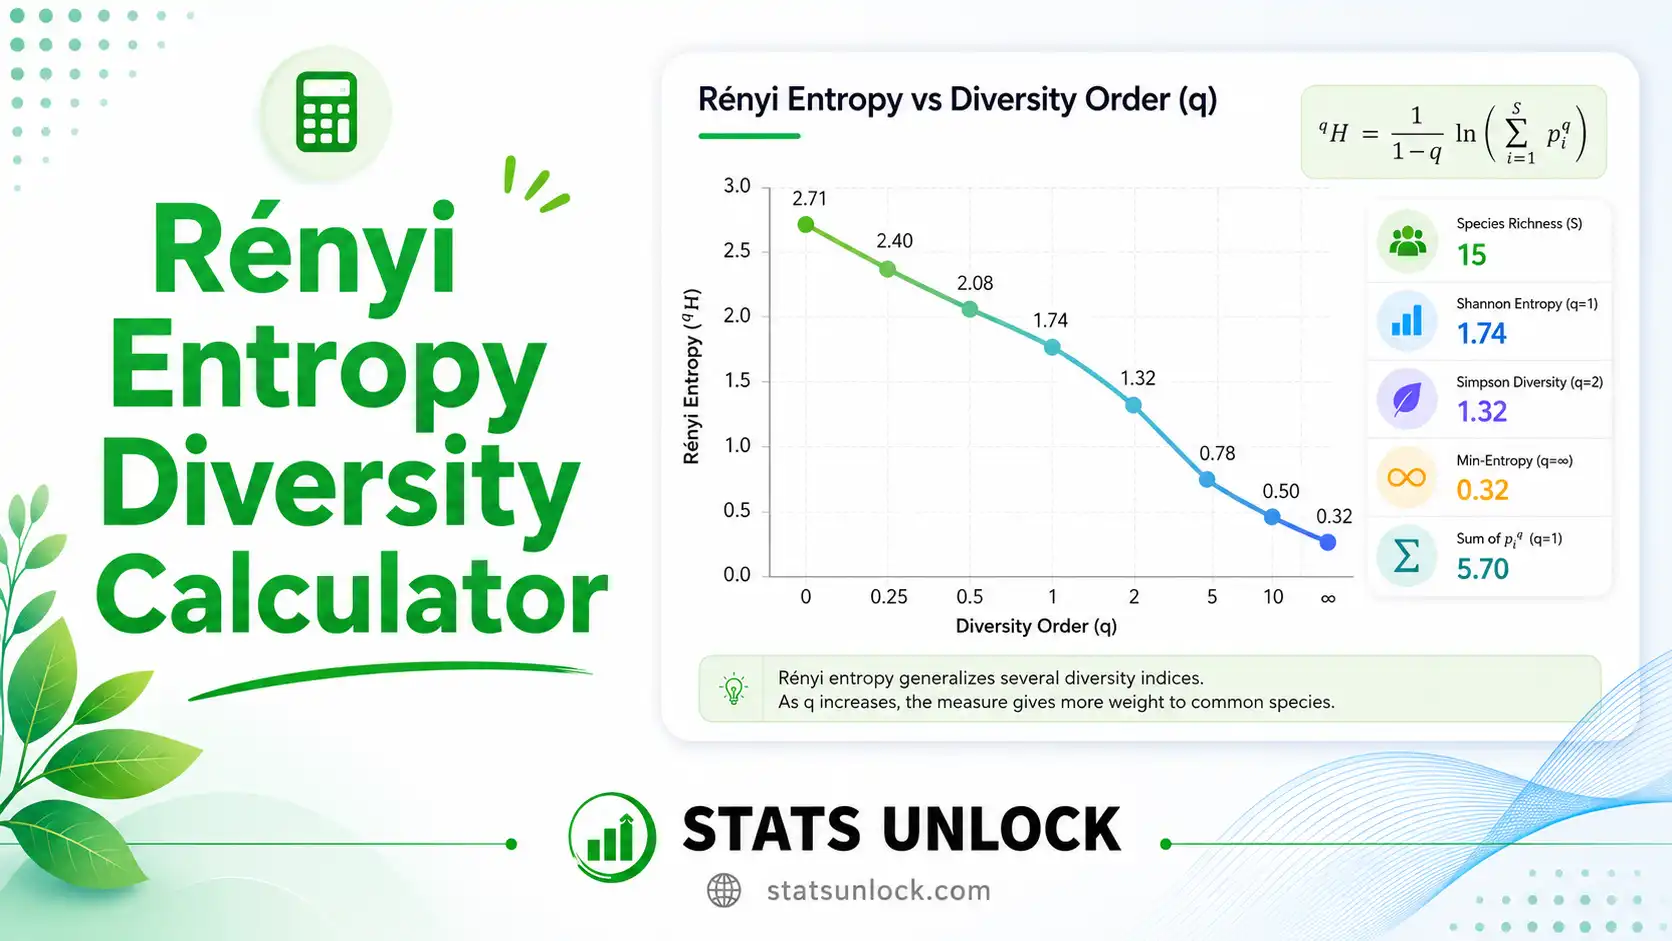
α = 0 → log richness · α = 1 → Shannon · α = 2 → log Inverse Simpson · α → ∞ → Berger-Parker
Profile is computed from α = 0 to αmax at 41 evenly spaced points.
📊 Results
Rényi Entropy Equation
The Rényi entropy of order α (Hα) is defined as:
- Hα: Rényi entropy at order α (units depend on log base)
- α: Order of diversity (sensitivity to abundant species; α ≥ 0, α ≠ 1)
- pi: Relative abundance (proportion) of species i; pi = ni / N
- S: Total species richness (number of species observed)
- N: Total individuals (∑ ni)
- Limit α → 1: H1 = − ∑ pi ln pi (Shannon entropy)
- Hill number: qD = exp(Hα=q) — effective number of species
📋 Detailed Results Table
| Statistic | Value | Description |
|---|
Rényi Diversity Profile (Hα vs α)
Hill Numbers Profile (qD vs q)
Rank-Abundance (Whittaker) Plot
Relative Abundance per Species
🧭 Interpretation Results
✍️ How to Write Your Results in Research
🪧 Research Poster Panel
🔬 Technical Notes — Formula Derivation, Assumptions & Limitations
Definition
Rényi entropy Hα is a one-parameter family of entropies introduced by Alfréd Rényi (1961). For a probability distribution {pi} over S species, Hα = (1/(1 − α)) · log ∑ piα. The Shannon entropy is recovered in the limit α → 1 by L'Hôpital's rule.
Special cases
- α = 0: H0 = log S (log species richness — counts only presence)
- α → 1: H1 = − ∑ pi log pi (Shannon-Weaver)
- α = 2: H2 = − log ∑ pi2 = log (1/λ) (collision / Inverse Simpson on log scale)
- α → ∞: H∞ = − log max(pi) (Berger-Parker on log scale)
Assumptions
- Counts are independent observations of a closed community.
- Sampling effort is sufficient to capture rare species (especially for low α).
- Species are taxonomically resolved; no double-counting.
- pi > 0 for all species included; absent species are excluded.
Limitations
- Hα at low α is highly sensitive to under-sampling — rare species detection.
- Single-α reporting can be misleading; always show the full profile.
- Profiles that cross between two communities indicate non-comparable diversities.
- Does not account for phylogenetic, functional, or spatial diversity.
🎯 When to Use Rényi Entropy
Decision Checklist
- You want a unified framework that includes Shannon, Simpson, and richness as special cases
- You need to assess sensitivity to rare vs. common species across α
- You want to compare communities using full diversity profiles, not single numbers
- Sampling effort is standardized or rarefied between sites
- You only have presence/absence data — use richness or Jaccard instead
- Your sample is too small (< 30 individuals) — Rényi at low α is unreliable
- You need to incorporate phylogenetic distance — use phylogenetic Hill numbers
Real-World Examples
🦅 Bird Point-Counts
Compute Rényi profiles for two forest patches; crossing profiles signal non-comparable assemblages requiring habitat-specific management.
📷 Camera Trap Mammals
Profile of α = 0 (richness) to α = ∞ (dominance) reveals whether one large carnivore dominates the carnivore guild.
🌳 Tree Plot Inventory
Rényi profile across permanent plots tracks diversity recovery after selective logging.
🐝 Pollinator Surveys
Compare Rényi entropy at α = 1 (Shannon) and α = 2 (Inverse Simpson) to detect dominance shifts under floral-resource changes.
Sampling Design Guidance
Aim for ≥ 30 individuals per replicate and ≥ 3 replicates per habitat type. Use species accumulation curves to confirm asymptotic richness before computing α = 0. For α ≥ 2, smaller samples are tolerable because higher orders down-weight rare species.
Related Metrics — Decision Tree
- If you want abundance-weighted diversity (single number) → use the Shannon-Wiener index calculator (equivalent to Rényi at α = 1)
- If you want a dominance / inverse Simpson number → use the Simpson's diversity index calculator (related to Rényi at α = 2)
- If you only need species count → use the species richness calculator (equivalent to Rényi at α = 0)
- If you want a single evenness number → use the evenness index calculator (Pielou's J′, Shannon evenness)
- If you need rank-abundance and percent shares → use the relative abundance calculator
- If you want effective species count → Hill numbers (qD = exp Hα=q) — already shown in this tool's profile chart
- If you have phylogenetic data → Faith's PD or phylogenetic Hill numbers
- If you want spatial turnover → β-diversity (Whittaker or Sørensen)
🔍 Competitor Gap Keywords & Content Gaps to Fill
🎯 Competitor Gap Keywords (uncovered by current top SERPs)
- renyi entropy ecology calculator online free
- renyi diversity profile worked example
- how to interpret renyi entropy alpha values
- renyi vs shannon vs simpson comparison guide
- renyi entropy hill number relationship explained
- generalized entropy biodiversity step-by-step
- renyi alpha diversity for camera trap data
- plot renyi diversity profile in R alternative
- renyi entropy formula with worked species counts
- biodiversity renyi index for conservation reports
📝 Content Gaps to Fill (high-intent missing on top pages)
- Side-by-side worked example using real abundance data
- Plain-English interpretation rubric for each α value
- Crossing-profile diagnostic for comparing two sites
- Effective-species (Hill) translation for non-statisticians
- Sampling-effort guidance and rarefaction recommendation
- Downloadable Doc and PDF reports for thesis appendices
- Connection to publication standards (APA 7th, journal style)
- Research poster panel template ready to print
- FAQ block addressing common reviewer questions
- Decision tree linking Rényi to closely related indices
📘 How to Use This Calculator (10 Steps)
- Step 1 — Name your study site in the Group / Study Area field. The name auto-fills throughout the report.
- Step 2 — Enter species counts as comma-separated values, e.g.,
52, 48, 55, 61, 47. Or click any of the 5 sample datasets. - Step 3 — (Optional) Switch to Column Entry to label each count with a species name; labels appear on charts and tables.
- Step 4 — (Optional) Upload a CSV/Excel file; the column picker isolates numeric columns and previews 8 rows.
- Step 5 — Choose the primary order α (default α = 1 → Shannon). Try α = 0, 1, 2, ∞ to scan dominance structure.
- Step 6 — Choose the log base (ln by default; base 2 reports H in bits).
- Step 7 — Set αmax for the diversity profile (default 6). The profile is computed at 41 points.
- Step 8 — Click Run Analysis. Summary cards, formula block, results table, four charts, interpretation, poster, FAQ, and conclusion populate together.
- Step 9 — Review the four visualizations: Rényi profile, Hill numbers profile, rank-abundance plot, relative-abundance bar chart.
- Step 10 — Download the report. Click Download Doc for a plain-text appendix, or Download PDF for a print-ready A4 report.
❓ Frequently Asked Questions
Q1. What is Rényi entropy and when should I use it?
Rényi entropy is a generalized family of diversity measures parameterized by an order α that controls sensitivity to rare versus common species. Use it when you need a unified framework that includes Shannon, Simpson, and species richness as special cases and you want to inspect the full diversity profile rather than a single number. Field example: comparing avian Rényi profiles between intact and logged forest plots in a single figure.
Q2. What data do I need to calculate Rényi entropy?
You need a vector of species abundance counts or proportions. Comma-separated counts work best, e.g., 52, 48, 55, 61, 47. The tool also accepts CSV/Excel uploads via the Upload tab and labelled rows via Column Entry. Minimum quality: ≥ 30 individuals total, all counts non-negative, no zero-only rows.
Q3. What does a high vs low Rényi entropy mean ecologically?
Higher Rényi entropy at any α indicates greater diversity at that scale of dominance sensitivity. At α = 0 you read off log species richness; at α = 1 you read Shannon entropy; at α = 2 the log of Inverse Simpson; at α → ∞ the log of the most abundant species' inverse proportion. Healthy intact tropical forest avian communities typically yield H1 ≈ 2.6–3.5 ln units.
Q4. How does Rényi entropy differ from Shannon and Simpson?
Rényi entropy generalizes both. At order α = 1 it equals Shannon's H. At α = 2 it equals −ln(∑pi2) = log Inverse Simpson. The Rényi profile shows all of these on one curve, exposing dominance structure that single-α reporting hides. Use Shannon for general reporting; use the Rényi profile for site comparisons.
Q5. What are the assumptions and limitations?
Assumptions: independent counts, closed community, adequate detection of rare species, taxonomic resolution. Limitations: Hα at low α is sensitive to under-sampling; profiles that cross between sites indicate non-comparable diversities; phylogenetic and functional dimensions are not captured. Use rarefaction or occupancy modelling when sampling effort is unequal.
Q6. How much sampling effort do I need?
At least 30 individuals per replicate and ideally a species accumulation curve approaching asymptote. Higher α (≥ 2) tolerates smaller samples because rare species are down-weighted. For α = 0 (richness), aim for ≥ 80% Chao1 coverage before reporting.
Q7. Can I compare Rényi values between sites or time periods?
Only when sampling effort is standardized or rarefied to a common base. Compare full diversity profiles rather than single α values. If two profiles cross, the communities are non-comparable in a single ranking and you must report multiple α points. Use bootstrapping or permutation tests for confidence intervals.
Q8. How do I report Rényi entropy in an ecology journal?
Report Hα at α = 0, 1, 2 and ∞, with sample size N and species richness S. Show the diversity profile as a figure. State the log base. Cite Rényi (1961) and the software/version used. See the How to Write Your Results in Research section above for five reporting templates.
Q9. Can I use this calculator for my thesis or peer-reviewed paper?
Yes for educational and exploratory analysis; for formal publication, verify results in R using the vegan::renyi() function or the hilldiv package and report both. Cite the tool: "Stats Unlock. (2026). Rényi Entropy Diversity Calculator. Retrieved from https://statsunlock.com."
Q10. My index value seems unexpectedly high or low — what might have gone wrong?
Common causes: a single dominant species depressing higher-order entropy; under-sampled rare species inflating α = 0; data entry errors (wrong column, mixed units); unequal effort across replicates. Reload one of the sample datasets to confirm the tool is behaving correctly, then re-check your raw counts.
🔍 Conclusion
▶ Run the analysis above to generate a personalised, detailed conclusion for your dataset.
🔗 Related Diversity & Ecology Calculators
Rényi entropy generalises several classic diversity indices. Pair this calculator with the related Stats Unlock tools below to compute, compare, and cross-validate biodiversity metrics from the same species-abundance dataset:
📚 References
The Rényi entropy diversity index is grounded in foundational biodiversity, ecology, and wildlife research. Key references with links:
- Rényi, A. (1961). On measures of entropy and information. Proceedings of the Fourth Berkeley Symposium on Mathematical Statistics and Probability, 1, 547–561. link
- Hill, M. O. (1973). Diversity and evenness: A unifying notation and its consequences. Ecology, 54(2), 427–432. https://doi.org/10.2307/1934352
- Jost, L. (2006). Entropy and diversity. Oikos, 113(2), 363–375. https://doi.org/10.1111/j.2006.0030-1299.14714.x
- Magurran, A. E. (2004). Measuring Biological Diversity. Blackwell Publishing. link
- Tóthmérész, B. (1995). Comparison of different methods for diversity ordering. Journal of Vegetation Science, 6(2), 283–290. https://doi.org/10.2307/3236223
- Chao, A., Chiu, C.-H., & Jost, L. (2014). Unifying species diversity, phylogenetic diversity, functional diversity, and related similarity and differentiation measures through Hill numbers. Annual Review of Ecology, Evolution, and Systematics, 45, 297–324. https://doi.org/10.1146/annurev-ecolsys-120213-091540
- Shannon, C. E., & Weaver, W. (1949). The Mathematical Theory of Communication. University of Illinois Press. link
- Simpson, E. H. (1949). Measurement of diversity. Nature, 163, 688. https://doi.org/10.1038/163688a0
- Pielou, E. C. (1966). The measurement of diversity in different types of biological collections. Journal of Theoretical Biology, 13, 131–144. https://doi.org/10.1016/0022-5193(66)90013-0
- Oksanen, J., et al. (2022). vegan: Community Ecology Package. R package version 2.6-4. https://CRAN.R-project.org/package=vegan
- Alberdi, A., & Gilbert, M. T. P. (2019). hilldiv: an R package for the integral analysis of diversity based on Hill numbers. bioRxiv. https://doi.org/10.1101/545665
- Patil, G. P., & Taillie, C. (1982). Diversity as a concept and its measurement. Journal of the American Statistical Association, 77(379), 548–561. https://doi.org/10.1080/01621459.1982.10477845
- GBIF — Global Biodiversity Information Facility. https://www.gbif.org


