Fisher's α Diversity Calculator
Sample-size-independent biodiversity index from the log-series distribution — for ecologists, wildlife biologists, and conservation researchers.
📥 Data Input
Enter individual counts per species. Comma-separated (default), newlines, semicolons, or tabs all work.
Supports .csv, .txt, .xlsx, .xls — headers detected automatically.
Add species rows below. Empty rows are ignored.
⚙️ Analysis Configuration
Used in interpretation paragraphs, summary cards, poster, and exports.
Substituted into reporting examples ("avian diversity", etc.).
📊 Results
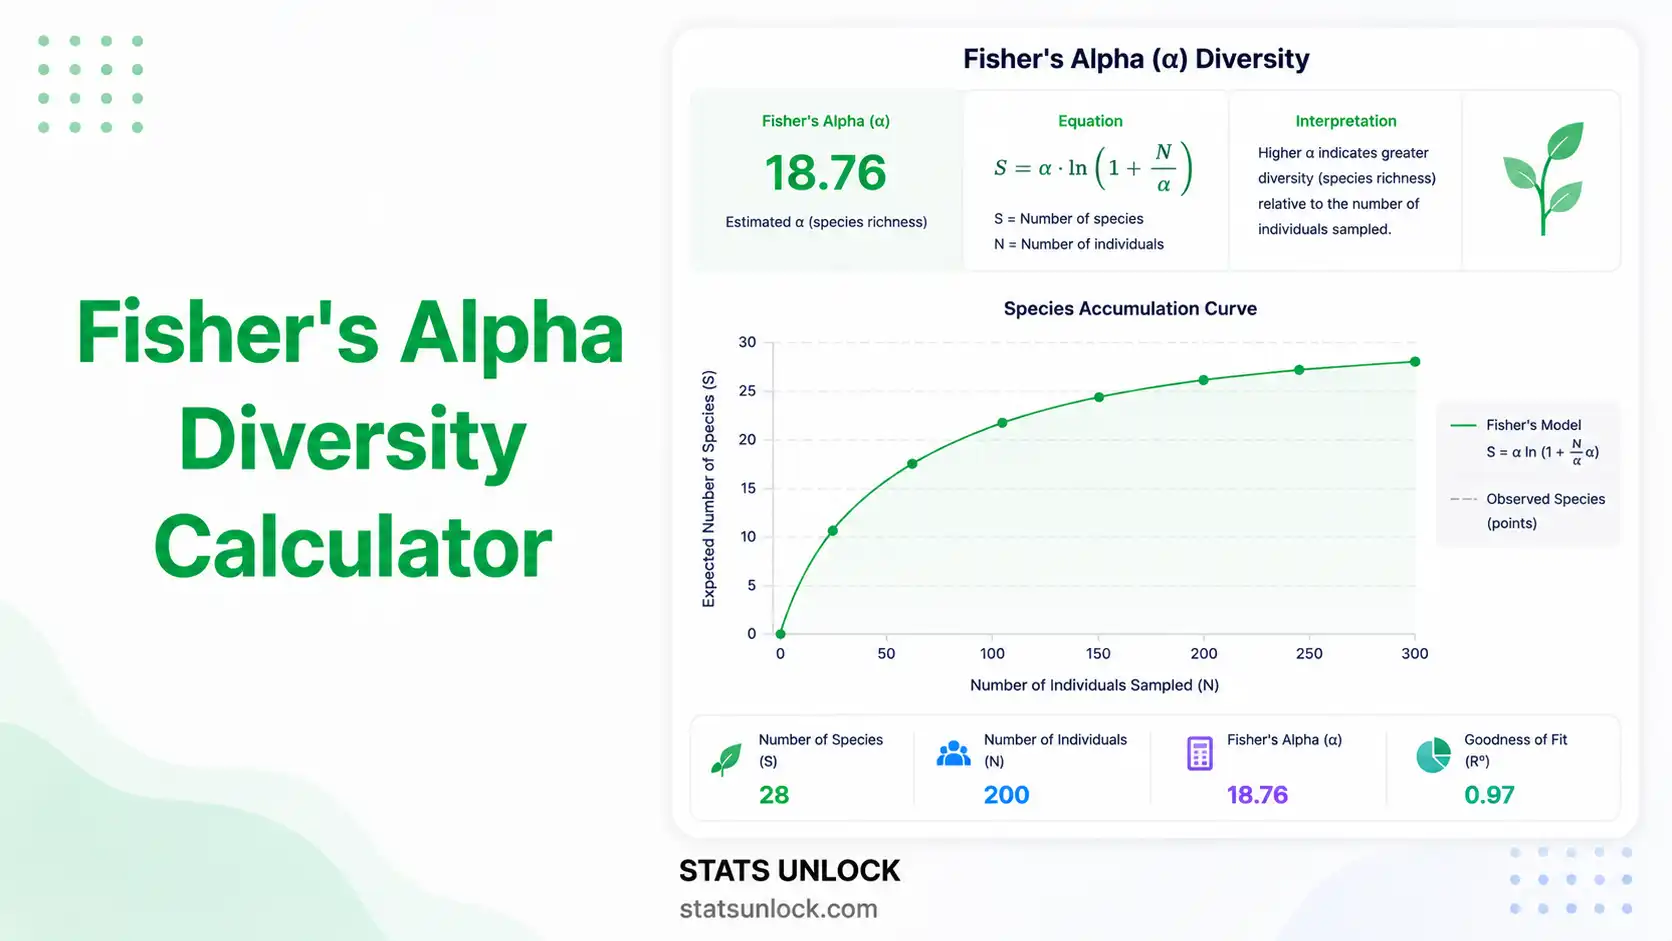
Fisher's Alpha Equation
Fisher's α is the parameter of the log-series distribution, found by solving:
where the expected number of species with n individuals follows:
- α: Fisher's alpha — the diversity parameter (sample-size-independent)
- S: Observed species richness — the number of species with at least one individual
- N: Total number of individuals across all species
- x: Log-series scaling parameter, typically very close to 1 (large N)
- Sn: Expected number of species with exactly n individuals
- ln: Natural logarithm (base e)
Detailed Results Table
Visualizations
📝 Interpretation Results
✍️ How to Write Your Results in Research
🔍 Detailed Conclusion
▶ Run the analysis above to generate a personalised conclusion for your dataset.
🔬 Technical Notes — Derivation, Assumptions & Limitations
Derivation from the Log-Series
Fisher's α arises from the log-series distribution, in which the expected number of species represented by exactly n individuals is:
Sn = α · xn / n
Summing across all n ≥ 1 yields the species richness:
S = −α · ln(1 − x)
Summing the products n·Sn yields the total individuals:
N = α · x / (1 − x)
Eliminating x gives the implicit equation that this calculator solves numerically: S = α · ln(1 + N/α). The Newton-Raphson method converges in ≤ 12 iterations for any S, N > 0.
Assumptions
- Species abundances follow (or approximate) a log-series distribution.
- Sampling is random and individuals are independent.
- No spatial or temporal pseudoreplication.
- Species identifications are reliable and consistent.
Limitations
- Performs poorly when communities follow other distributions (e.g., log-normal in very mature climax communities).
- Cannot distinguish between low diversity due to dominance and low diversity due to under-sampling — examine the rank-abundance plot.
- Species-level identification errors directly inflate or deflate S, biasing α.
- Like all single-number indices, α masks community composition (β-diversity is needed for that).
🛠️ How to Use This Tool — Step-by-Step Guide
🎯 When to Use This Tool — Decision Checklist
🪧 Research Poster Panel
A professionally formatted, ready-to-print research poster — auto-filled from your latest run, structured for A0 conference printing.
🎨 Poster Design Specifications
- Title: 72–96 pt, Poppins / Montserrat / DM Sans, bold, all caps
- Section headers: 36–48 pt, bold, primary green #15803d
- Body: 24–28 pt — minimum 24 pt for 1 m readability
- Callout numbers: 60–80 pt, bold, green #22c55e
- Background: White or light grey #f8f9fa
- Accents: Forest green #15803d (primary), warm amber #d97706 (highlights), muted red #dc2626 (low diversity)
- Sizes: A0 portrait 841×1189 mm · A0 landscape 1189×841 mm · 36×48 in 914×1219 mm · A1 594×841 mm
- Print resolution: 300 dpi minimum, export PDF/X-1a for print shops
- Software: Canva (free), PowerPoint, Adobe Illustrator, Inkscape
🎯 Competitor Gap Keywords & Content Gaps to Fill
Strategic content opportunities where existing online resources are weak — fill these gaps to capture top-of-page SERP positions.
- "fisher's alpha vs shannon" — explanatory comparison content
- "how to calculate fisher's alpha in r" — step-by-step coding tutorial
- "fisher's alpha excel formula" — spreadsheet implementation
- "fisher's alpha interpretation" — threshold tables
- "log-series distribution ecology" — concept explainer
- "sample size independent diversity index" — comparative review
- "fisher's alpha tropical biodiversity" — case studies
- "fisher alpha confidence interval" — statistical inference angle
- "alpha diversity calculator" — practical tool intent
- "fisher's log-series fit test" — goodness-of-fit content
- Worked examples for entomology & museum collections
- R code snippet using
vegan::fisher.alpha() - Python implementation with
scipy.optimize.brentq - Side-by-side α vs H' vs D comparison table
- Goodness-of-fit chi-square for log-series
- Bootstrap 95% CI for Fisher's α
- Multi-site comparison workflow
- Field data collection protocol templates
- Case study: light-trap insect diversity
- Common mistakes when applying Fisher's α
❓ Frequently Asked Questions
🔗 Related Diversity Calculators
Fisher's α is most powerful when triangulated with companion diversity metrics. Use these free Stats Unlock calculators to build a complete biodiversity profile for your study site.
📚 References
The following references support the ecological and statistical methods used in this Fisher's Alpha diversity index calculator, covering biodiversity measurement, log-series species abundance distributions, and best practices in ecological sampling for wildlife and conservation studies.
- Fisher, R. A., Corbet, A. S., & Williams, C. B. (1943). The relation between the number of species and the number of individuals in a random sample of an animal population. Journal of Animal Ecology, 12(1), 42–58. https://doi.org/10.2307/1411
- Williams, C. B. (1964). Patterns in the balance of nature, and related problems in quantitative ecology. Academic Press.
- Magurran, A. E. (2004). Measuring biological diversity. Blackwell Publishing. Publisher page
- Krebs, C. J. (1999). Ecological methodology (2nd ed.). Benjamin Cummings.
- Hayek, L. C., & Buzas, M. A. (2010). Surveying natural populations: Quantitative tools for assessing biodiversity (2nd ed.). Columbia University Press. Publisher page
- Pielou, E. C. (1975). Ecological diversity. John Wiley & Sons.
- Hubbell, S. P. (2001). The unified neutral theory of biodiversity and biogeography. Princeton University Press. Publisher page
- Oksanen, J., Simpson, G. L., Blanchet, F. G., et al. (2024). vegan: Community ecology package. R package version 2.6-8. https://CRAN.R-project.org/package=vegan
- Chao, A., Chazdon, R. L., Colwell, R. K., & Shen, T. J. (2005). A new statistical approach for assessing similarity of species composition with incidence and abundance data. Ecology Letters, 8(2), 148–159. https://doi.org/10.1111/j.1461-0248.2004.00707.x
- Gotelli, N. J., & Colwell, R. K. (2011). Estimating species richness. In A. E. Magurran & B. J. McGill (Eds.), Biological diversity: Frontiers in measurement and assessment (pp. 39–54). Oxford University Press.
- Taylor, L. R., Kempton, R. A., & Woiwod, I. P. (1976). Diversity statistics and the log-series model. Journal of Animal Ecology, 45(1), 255–272. https://doi.org/10.2307/3779
- Condit, R., Hubbell, S. P., Lafrankie, J. V., et al. (1996). Species-area and species-individual relationships for tropical trees: A comparison of three 50-ha plots. Journal of Ecology, 84(4), 549–562. https://doi.org/10.2307/2261477
- R Core Team. (2024). R: A language and environment for statistical computing. R Foundation for Statistical Computing. https://www.R-project.org/
- Colwell, R. K. (2013). EstimateS: Statistical estimation of species richness and shared species from samples (Version 9). http://purl.oclc.org/estimates


