Tolerance & Attitude Score Calculator
Quantify human attitudes and tolerance toward wildlife from Likert-scale survey data. Designed for human-wildlife coexistence, conflict, and conservation social-science research.
📝 Step 1 — Enter Your Survey Data
Substitutes into all generated reports, charts, and the research poster.
Dataset 1 is pre-loaded. Switch any time to compare.
0 valid responses
Headers are detected automatically. Choose the column containing the Likert scores or composite score per respondent.
Each row = one respondent. Each cell holds an item score from 1 (Strongly Disagree) to 5 (Strongly Agree). Numbers outside 1–5 are ignored. Hover any row or column to reveal its ✕ remove button.
⚙️ Step 2 — Analysis Settings
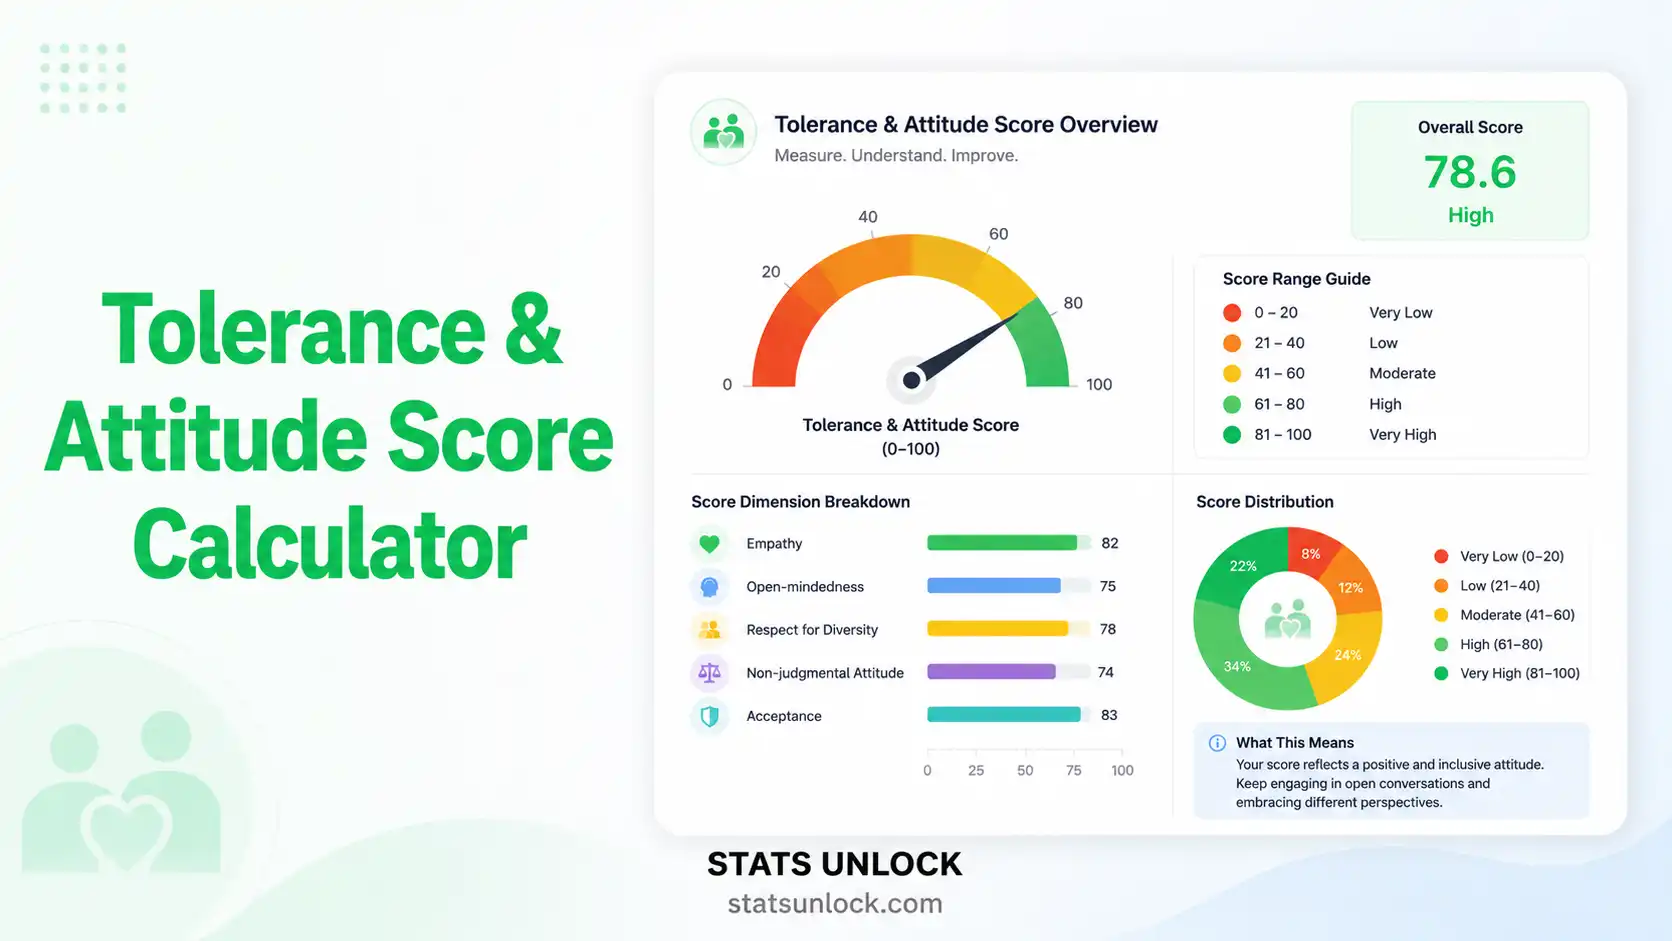
📊 Results — Tolerance & Attitude Score
Tolerance & Attitude Score Equation
The Tolerance & Attitude Score (TAS) is computed as a standardised composite of Likert-scale responses across all items and respondents.
- TAS: Tolerance & Attitude Score, rescaled to 0–100
- x̄: Mean Likert response across all items and respondents (after reverse-coding)
- Lmax: Maximum value of the Likert scale (e.g., 5 for a 5-point scale)
- 1: Minimum value of the Likert scale (anchoring the index to 0)
- 0: Complete intolerance / strongly negative attitude
- 100: Maximum tolerance / strongly positive attitude
📊 Score Distribution Histogram
🥧 Tolerance Tier Composition
📈 Item-Level Mean Scores
🎯 Likert Response Composition (Stacked)
| Statistic | Value | Description |
|---|
🔬 Detailed Interpretation of Results
▶ Run the analysis above to generate a personalised interpretation.
✍️ How to Write Your Results in Research
Five ready-to-use reporting templates, each automatically populated with the current Tolerance & Attitude Score, sample size, and tier label. Click 📋 Copy on any card to lift the paragraph straight into your manuscript.
Run the analysis above to auto-fill this example.
Key journal conventions
- Report TAS with mean and standard deviation, plus sample size (n).
- State the Likert scale range and item count explicitly.
- Cite the original tolerance scale (e.g., Bruskotter & Wilson, 2014).
- Always include Cronbach's α for internal reliability.
Run the analysis above to auto-fill this example.
Key dissertation conventions
- Combine Methods + Results paragraphs with clear linkage.
- Name the analysis software (R, SPSS, Stata) and version.
- Report subgroup means and statistical tests of difference.
- Discuss reverse-coding decisions for negatively worded items.
Run the analysis above to auto-fill this example.
Key plain-language rules
- Avoid statistical jargon and scale symbols.
- Translate the score into percentage-style language.
- End with a clear management or policy recommendation.
- Suitable for park managers, agency staff, and local government.
Run the analysis above to auto-fill this example.
Abstract conventions
- Stay within 150–250 words.
- Use four labelled sections: Background, Methods, Results, Conclusion.
- Lead with the most striking numerical finding.
- End with one sentence on conservation implication.
Run the analysis above to auto-fill this example.
Monitoring report conventions
- Compare current year score to baseline year(s).
- Use trend language (improving, declining, stable).
- Tie the score to a management threshold or trigger.
- State follow-up survey schedule and methodology.
🪧 Research Poster Panel
A complete, presentation-ready poster scaffold. Every section auto-fills from your live analysis. Copy the full poster text and drop it straight into Canva, PowerPoint, Inkscape, or Adobe Illustrator.
▸ Run the analysis to generate the poster title
🌿 Introduction & Research Question
___
🔬 Methods
___
📊 Results — Key Values
___
🎨 Suggested Visuals
- Top-left: Score Distribution Histogram (from Chart 1)
- Top-right: Tolerance Tier Pie/Donut (from Chart 2)
- Bottom-left: Item-Level Mean Scores (from Chart 3)
- Bottom-right: Likert Response Composition stacked bars (from Chart 4)
💬 Discussion
___
🎯 Conclusions & Take-Home Message
- ___
📚 Poster Footer
▸ Poster Design Specifications (typography, palette, sizes, software)
Typography: Title 72–96 pt bold (Montserrat / DM Sans / Fira Sans). Section headers 36–48 pt bold. Body 24–28 pt (24 pt absolute minimum for 1 m reading distance). Callout numbers 60–80 pt bold.
Palette: Background white or light grey (#f8f9fa). Primary accent deep forest green (#1f6a43). Secondary accent warm amber (#d97706). Danger/low tolerance muted red (#b73a2c). Never use more than 3 accent colours.
Standard poster sizes: A0 portrait 841 × 1189 mm (international conferences), A0 landscape 1189 × 841 mm, 36 × 48 in 914 × 1219 mm (North-American standard), A1 portrait 594 × 841 mm (seminars).
Print resolution: 300 dpi minimum. Export as PDF / X-1a.
Software: Canva (free), Adobe Illustrator, Inkscape, PowerPoint, Affinity Publisher.
🔍 Detailed Conclusion
▶ Run the analysis above to generate a personalised conclusion for your dataset.
📐 Technical Notes — Formula Derivation, Assumptions, Limitations
Extended Formula
For multi-item composite tolerance/attitude scales, the per-respondent score is the mean (or sum) of k Likert items after reverse-coding negatively worded items:
TASi = ( ( (1/k) · Σj=1..k rij* ) − 1 ) / ( Lmax − 1 ) × 100
where rij* is the reverse-coded response of respondent i to item j, and k is the item count. The group-level score is the mean of TASi across respondents.
Assumptions
- Likert items are treated as interval data — a standard but contested assumption in psychometrics. For ordinal-strict analysis, supplement with Spearman ρ or non-parametric tests.
- Negatively worded items have been (or will be) reverse-coded so all items point toward the same direction.
- Internal consistency (Cronbach's α ≥ 0.70) confirms items measure the same latent construct.
- Respondents represent the target population — sampling design must control for self-selection and social-desirability bias.
Limitations
- Attitude ≠ behaviour: a high score does not guarantee tolerant action (e.g., not killing predators in retaliation).
- Context dependency: scores reflect attitudes at the time of survey; major events (livestock loss, attack on a human) shift attitudes rapidly.
- Social-desirability bias: respondents may overstate tolerance when surveys are not anonymous.
- Aggregation hides variance: a community mean of 60 may hide a bimodal distribution of strongly tolerant and strongly intolerant subgroups — always report SD and visualise distributions.
- Cross-cultural comparability: a "neutral" Likert response means different things in different cultures and may inflate or deflate scores.
✅ When to Use This Tool
Decision Checklist
- ✓ You have Likert-scale survey data on attitudes toward a wildlife species or management practice.
- ✓ You want a single comparable index across respondents, communities, or time points.
- ✓ Your survey items have been reverse-coded where necessary.
- ✓ You plan to publish in a human dimensions, conservation, or coexistence journal.
- ✗ Do NOT use if respondents represent fewer than ~30 individuals — index estimates become unstable.
- ✗ Do NOT use raw scores to compare across studies that used different Likert lengths without rescaling.
- ✗ Do NOT interpret a high score as predicting behaviour — pair with behavioural intent items.
Real-World Examples (USA-focused)
- Gray wolf reintroduction (Yellowstone Gateway, Montana): Compare rancher vs. resident vs. visitor attitudes after a culling event.
- Black bear urban interface (Lake Tahoe Basin, California): Score before/after Bear-Wise community education program.
- Urban coyote management (Chicago, Illinois): Track residents' tolerance after a high-profile pet-attack incident.
- Alligator coexistence (Everglades buffer communities, Florida): Compare long-term residents vs. recent newcomers.
- Mountain lion expansion (Colorado Front Range): Tolerance score by suburban density gradient.
Sample-Size Guidance
- ≥ 100 respondents per stakeholder group for stable mean estimation.
- ≥ 300 respondents total for multivariate (regression, SEM) modelling.
- ≥ 6 items per construct for Cronbach's α to converge.
- Use stratified or quota sampling to ensure adequate representation across age, gender, occupation, residence tenure.
Related Metrics — Decision Tree
Need a single tolerance index?      → Tolerance & Attitude Score (this tool)
Need to weight items differently?   → Weighted attitude composite
Want subgroup difference testing?   → ANOVA / Kruskal-Wallis
Need latent construct extraction?   → Exploratory Factor Analysis (EFA)
Predicting behavioural intent?      → Theory of Planned Behaviour models
Long-term trend analysis?           → Repeated cross-sectional surveys + GLMM
📖 How to Use This Tool — Step-by-Step Guide
- Enter Your Data: Paste Likert responses (one respondent per row, comma-separated items), upload a CSV/Excel file, or use the manual entry table. For multi-group comparisons, switch to Multi-Group Entry and add stakeholder groups (group names are fully editable — e.g., "Ranchers", "Hikers", "Hunters", "Conservation NGO members").
- Choose a Sample Dataset: Five built-in USA datasets demonstrate the tool with realistic data: Gray Wolves (Yellowstone), Black Bears (Lake Tahoe), Coyotes (Chicago), Alligators (Everglades), Mountain Lions (Colorado Front Range).
- Configure Analysis Settings: Set your Likert scale length (5-point is most common), output scale (0–100 recommended for comparability), reverse-coding handling, and target species name.
- Run the Analysis: Click the green button. The tool computes the mean, standard deviation, sample size, tier classification (HIGH / MODERATE / LOW), and the standardised 0–100 score in real time.
- Read the Summary Cards: Green = high tolerance (≥ 67), amber = moderate (34–66), red = low / oppositional (≤ 33). The big number is your TAS.
- Read the Full Results Table: Each row shows a sub-component — n (sample size), mean, SD, min, max, percent positive, percent negative.
- Examine the Four Visualizations: (1) Histogram shows the score distribution; (2) Pie chart shows tolerance-tier composition; (3) Item-level bar chart identifies the most/least supported items; (4) Stacked bar shows full Likert response composition.
- Read the Detailed Interpretation: Five auto-filled paragraphs translate your TAS into plain English with site-specific context.
- Copy a Reporting Example: Five pre-written templates cover journal articles, dissertations, policy briefs, conference abstracts, and monitoring reports — all auto-filled with your numbers.
- Export Your Results: "Download Doc" produces a plain-text .txt report. "Download PDF" creates a print-ready A4 PDF with cover page, methods, full results, interpretation, conclusion, and references.
Worked example: A survey of 120 residents in the Yellowstone Gateway communities (Montana, USA) yields a mean response of 3.4 on a 5-point scale across 8 items. TAS = (3.4 − 1) / (5 − 1) × 100 = 60, indicating MODERATE tolerance toward gray wolves — consistent with recent post-reintroduction surveys (Bruskotter & Wilson, 2014).
❓ Frequently Asked Questions
What is the Tolerance and Attitude Score in wildlife research?
The Tolerance and Attitude Score is a standardised index derived from Likert-scale survey responses that quantifies how communities perceive, accept, or oppose the presence of a target wildlife species or management practice. It converts ordinal attitude data into a single comparable number (typically 0–100) and is widely used in human-wildlife coexistence and conflict research.
How do I calculate a wildlife tolerance score from a Likert survey?
For each respondent, sum or average their Likert answers (1–5 or 1–7), reverse-code negatively worded items so all responses point the same direction, then rescale the mean to 0–100 using the formula (mean − 1)/(Lmax − 1) × 100. The community-level score is the mean of all individual scores.
What Likert scale should I use for human-wildlife conflict research?
A 5-point Likert scale (Strongly Disagree → Strongly Agree) is the most common in human-wildlife conflict and coexistence research because it balances respondent fatigue with sensitivity to attitude shifts. 7-point scales offer more granularity but increase translation issues across cultures.
How is tolerance different from attitude in wildlife research?
Attitude is the respondent's evaluative judgement (positive or negative feeling) about a species. Tolerance is the behavioural willingness to accept the species' presence and bear its costs (e.g., livestock loss, fear). A composite Tolerance & Attitude Score captures both dimensions and predicts behaviour better than either alone.
What is a good Cronbach's alpha for an attitude survey?
α ≥ 0.70 is the standard threshold for acceptable internal consistency. α ≥ 0.80 is good, α ≥ 0.90 is excellent. Values below 0.70 suggest your items measure more than one construct — consider running Exploratory Factor Analysis (EFA) to identify sub-scales.
Why reverse-code negatively worded Likert items?
Negatively worded items (e.g., "Wolves are a threat to my livestock") need reverse-coding so that a "5 — Strongly Agree" doesn't count as positive attitude. Without reverse-coding, a tolerant respondent could end up with a lower score than an intolerant one, distorting the index.
How many survey items should a tolerance scale have?
Most validated wildlife tolerance scales include 6–15 items. Fewer than 5 reduces reliability (Cronbach's α struggles to stabilise); more than 20 increases respondent fatigue and dropout. The Wildlife Tolerance Model (Kansky et al., 2016) typically uses 6–8 items per dimension.
Can I compare tolerance scores between stakeholder groups?
Yes. After computing individual scores, use one-way ANOVA (parametric) or Kruskal-Wallis (non-parametric) to test for significant differences between groups. For two groups, use Welch's t-test or Mann-Whitney U. Always report effect sizes (η², Cohen's d) alongside p-values.
What sample size is needed for a wildlife attitude survey?
A minimum of 100 respondents per stakeholder group is recommended; 300+ total allows for robust multivariate modelling and subgroup analysis. For community-level inference, aim for a sampling frame that covers at least 5–10% of adult residents, stratified by demographics where possible.
How should I report the Tolerance and Attitude Score in a journal?
Report the mean TAS, standard deviation, sample size (n), number of items (k), Likert scale range, Cronbach's α for internal consistency, and any subgroup comparisons. Always include the original validated scale citation (e.g., Bruskotter & Wilson, 2014; Kansky et al., 2016) and your reverse-coding decisions.
📚 References
The following references support the Tolerance & Attitude Score calculator, covering human-wildlife coexistence, conservation social science, and best practices in Likert-scale attitude measurement.
- Bruskotter, J. T., & Wilson, R. S. (2014). Determining where the wild things will be: Using psychological theory to find tolerance for large carnivores. Conservation Letters, 7(3), 158–165. https://doi.org/10.1111/conl.12072
- Kansky, R., Kidd, M., & Knight, A. T. (2016). A wildlife tolerance model and case study for understanding human wildlife conflicts. Biological Conservation, 201, 137–145. https://doi.org/10.1016/j.biocon.2016.07.002
- Kansky, R., & Knight, A. T. (2014). Key factors driving attitudes towards large mammals in conflict with humans. Biological Conservation, 179, 93–105. https://doi.org/10.1016/j.biocon.2014.09.008
- Treves, A., & Bruskotter, J. (2014). Tolerance for predatory wildlife. Science, 344(6183), 476–477. https://doi.org/10.1126/science.1252690
- Manfredo, M. J., Teel, T. L., & Henry, K. L. (2009). Linking society and environment: A multilevel model of shifting wildlife value orientations in the western United States. Social Science Quarterly, 90(2), 407–427. https://doi.org/10.1111/j.1540-6237.2009.00624.x
- Dickman, A. J. (2010). Complexities of conflict: The importance of considering social factors for effectively resolving human-wildlife conflict. Animal Conservation, 13(5), 458–466. https://doi.org/10.1111/j.1469-1795.2010.00368.x
- Carter, N. H., & Linnell, J. D. C. (2016). Co-adaptation is key to coexisting with large carnivores. Trends in Ecology & Evolution, 31(8), 575–578. https://doi.org/10.1016/j.tree.2016.05.006
- Frank, B., Glikman, J. A., & Marchini, S. (Eds.). (2019). Human-wildlife interactions: Turning conflict into coexistence. Cambridge University Press. https://doi.org/10.1017/9781108235730
- Bennett, N. J., et al. (2017). Conservation social science: Understanding and integrating human dimensions to improve conservation. Biological Conservation, 205, 93–108. https://doi.org/10.1016/j.biocon.2016.10.006
- Likert, R. (1932). A technique for the measurement of attitudes. Archives of Psychology, 22(140), 1–55. https://psycnet.apa.org/record/1933-01885-001
- Cronbach, L. J. (1951). Coefficient alpha and the internal structure of tests. Psychometrika, 16(3), 297–334. https://doi.org/10.1007/BF02310555
- Inskip, C., & Zimmermann, A. (2009). Human-felid conflict: A review of patterns and priorities worldwide. Oryx, 43(1), 18–34. https://doi.org/10.1017/S003060530899030X
- Zajac, R. M., et al. (2012). Learning to live with black bears: A psychological model of acceptance. Journal of Wildlife Management, 76(7), 1331–1340. https://doi.org/10.1002/jwmg.398
- R Core Team. (2024). R: A language and environment for statistical computing. R Foundation for Statistical Computing. https://www.R-project.org/
- Revelle, W. (2024). psych: Procedures for psychological, psychometric, and personality research. Northwestern University. https://CRAN.R-project.org/package=psych


