Faecal Standing Crop (FSC) Calculator
Estimate wildlife population density from pellet group counts using the Faecal Standing Crop method — the standard indirect technique for deer, elk, koalas, hares and other elusive mammals.
📋 Step 1 — Enter Your Pellet Count Data
Paste pellet group counts per plot, upload a CSV/Excel file, or use one of five sample datasets from real US and global wildlife studies.
Enter values plot-by-plot in the grid below.
⚙️ Step 2 — Survey Configuration
FSC density depends on three field-specific parameters: defecation rate, pellet decay/persistence time, and total sampled area. Default values reflect typical North American white-tailed deer surveys.
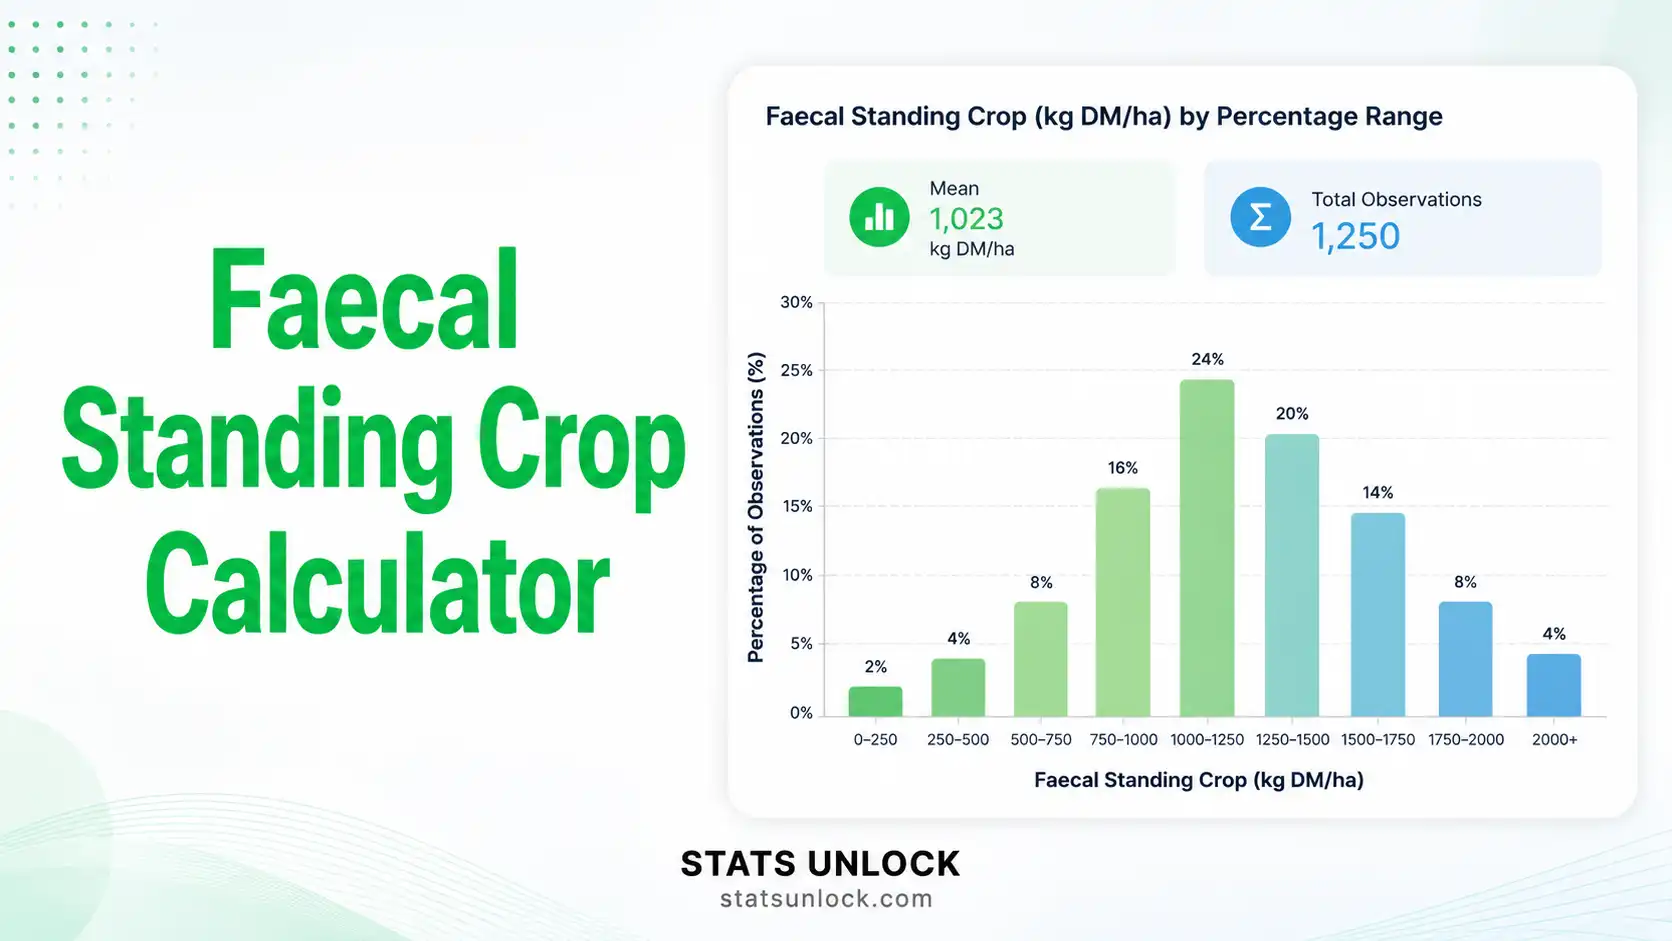
📊 Density Estimate Results
Faecal Standing Crop density estimate with field parameter breakdown.
📐 Faecal Standing Crop (FSC) Equation
Wildlife population density (D) is calculated from pellet group density divided by daily defecation rate and pellet persistence time:
- D: Population density (animals per unit area, e.g., km⁻²)
- P: Total pellet groups counted across all plots
- A: Total area sampled (sum of plot areas, in km²)
- R: Defecation rate (pellet groups per animal per day)
- t: Pellet persistence / decay time (days)
- ρ (rho): Observer detection probability (0–1; 1 = no correction)
📋 Full Results Table
Every computed value with field interpretation.
| Statistic | Value | Description |
|---|
🔍 Plain Language Interpretation
1. Detailed Interpretation Results
2. How to Write Your Results in Research
3. Research Poster Panel
🌿 Detailed Conclusion
▶ Run the analysis above to generate a personalised conclusion for your dataset.
📚 Reference Information
📐 Technical Notes — Formula Derivation, Assumptions, Limitations
Extended formula derivation. The FSC method assumes that pellet groups accumulate at a constant rate R (defecation rate per animal per day) and decay at a constant rate, persisting on average for t days. At equilibrium, the standing crop of pellet groups in any sampled area A equals the daily production multiplied by the mean residence time:
P = D × A × R × t
Solving for animal density gives D = P / (A × R × t). Adding the observer detection probability ρ in the denominator corrects for missed pellet groups during searches.
Core ecological assumptions:
- Defecation rate is constant across individuals, age classes, and seasons.
- Pellet persistence is uniform across the survey area (climate, soil, ground cover similar).
- Pellet groups are deposited randomly with respect to the sampling design.
- The animal population is at demographic equilibrium during the sampling window.
- All pellet groups in plots are detected (or detection probability is known).
Statistical assumptions:
- Plots are independent random samples of the study area.
- The mean pellet count per plot follows a Poisson or negative-binomial distribution.
- Total sampled area is much smaller than the study area (no edge effects).
Common limitations:
- Climate sensitivity: pellet decay varies 3-fold between hot wet and cold dry climates — using a wrong t value can bias density by ±50%.
- Defecation rate uncertainty: rates differ by sex, season, diet (browse vs. graze), and reproductive status.
- Detection bias: humans miss 20–40% of pellet groups in dense vegetation; scat detection dogs improve detection to 70–90%.
- Habitat heterogeneity: animals do not use habitat uniformly — stratified sampling is required for accurate density at landscape scale.
- Inter-observer variation: different observers count pellet groups differently — train all field staff with the same standardised protocol.
🎯 When to Use the FSC Method
Decision Checklist:
- ✓ You are surveying an elusive or cryptic mammal that produces detectable pellet groups
- ✓ Direct counts (spotlight, drive count) are infeasible due to dense vegetation or cost
- ✓ You can estimate species-specific defecation rate and pellet persistence
- ✓ You can deploy ≥ 30 randomly or systematically located plots
- ✓ You need population density (animals/area), not just an abundance index
- ✗ Do NOT use if pellet decay is highly variable across your study area without stratifying
- ✗ Do NOT use for animals that defecate communally in fixed latrines (skews counts)
- ✗ Do NOT use if you cannot reliably distinguish target species pellets from sympatric species
Real-world examples:
- White-tailed deer management (USA): State wildlife agencies in Pennsylvania, Michigan, and Wisconsin use FSC to set annual antlerless deer harvest quotas across state forests.
- Yellowstone elk monitoring: National Park Service biologists deploy FSC plots across winter range to track population trends in conjunction with aerial surveys.
- Koala conservation (Australia): The FSCM is the recommended national protocol for low-density koala populations across Queensland and New South Wales.
- European roe deer (UK, Spain, Portugal): Forest managers use FSC as a cost-effective alternative to thermal imaging in dense Mediterranean woodland.
Sampling design guidance:
- Minimum 30 plots per stratum; 50–100 plots optimal for low-density populations.
- Plot size 1 m², 4 m², or 100 m² — choose to get 3–10 pellet groups per plot.
- Random or systematic-random distribution across a GIS grid; avoid road bias.
- Sample during a single defined season to minimise behavioural variation.
- Repeat surveys annually in the same plots to detect trend.
Related metrics — decision tree:
- Want a quick relative abundance index, no density? → Pellet group count per km of transect
- Want a less biased density estimate with two visits? → Faecal Accumulation Rate (FAR)
- Want detection-corrected density? → Distance Sampling on pellet group transects
- Want individual-level data? → Genetic capture-recapture from pellets
📖 How to Use This Tool — 10-Step Guide
- Enter your data — paste comma-separated pellet counts, upload a CSV from your field tablet, or build a manual table. Example: 52, 48, 55, 61, 47.
- Try a sample dataset — five US wildlife scenarios (Yellowstone, Pennsylvania, Smoky Mountains, Texas, elk wintering ground) demonstrate the full workflow.
- Set your study area name — used in all interpretation paragraphs and export reports.
- Choose target species — defecation rate defaults adjust automatically.
- Enter defecation rate — for white-tailed deer in the USA, 25 groups/day is a widely used default; refine using species-specific literature.
- Enter decay time — temperate climates 90–150 days; tropical 30–60 days; arid/cold 150–250 days.
- Set plot size — must match your field protocol (default 100 m²).
- Adjust observer detection probability — 1.0 if uncorrected, 0.7 for typical human search, 0.85+ for trained observers, 0.9+ with detection dogs.
- Run the analysis — the tool computes density per km², per ha, per 100 ha plus standard error and confidence intervals.
- Read all sections — summary cards, four visualisations, interpretation, research-poster panel, and downloadable Doc/PDF report.
Worked example: A Pennsylvania state forest survey with 20 plots × 100 m² (= 2,000 m² = 0.002 km² total area), mean 52 pellet groups per plot, defecation rate 25/day, decay 120 days, gives:
D = 1,040 / (0.002 × 25 × 120 × 1.0) = 173.3 deer/km² → moderate-to-high density typical of suburban Pennsylvania.
❓ Frequently Asked Questions
What is the Faecal Standing Crop (FSC) method?
The Faecal Standing Crop method estimates wildlife population density by counting all pellet groups present in a sampled area at one point in time, then converting to animals per unit area using species-specific defecation rate and pellet decay/persistence time. It is the most widely used indirect technique for deer, elk, koalas and other elusive herbivores.
How do you calculate FSC density?
FSC density = pellet groups per unit area ÷ (defecation rate × persistence time × detection probability). With P = total pellet groups, A = total sampled area in km², R = defecation rate per animal per day, and t = pellet decay time in days, the formula is D = P / (A × R × t × ρ).
What is a typical defecation rate for white-tailed deer?
White-tailed deer in the United States typically defecate between 25 and 34 pellet groups per animal per day, varying with diet quality, season and reproductive status. Most North American studies use 25 groups/day for winter and 30–34 for summer when forage is more available.
What is FSC vs FAR?
FSC (Faecal Standing Crop) measures all pellet groups present in plots at one visit and divides by decay time. FAR (Faecal Accumulation Rate) clears all pellets from plots, then revisits after a known time interval to count newly deposited pellets. FSC is cheaper (one visit) but more sensitive to decay-rate uncertainty; FAR is less biased but doubles field cost.
How many sample plots do I need?
For statistically reliable density estimates, deploy a minimum of 30 plots per habitat stratum, with 50–100 plots optimal for low-density populations. Sample size depends on coefficient of variation in plot counts — high variability requires more plots to achieve a target precision (e.g., 20% relative standard error).
How long do deer pellets last in the field?
Pellet persistence ranges from 30 days in hot, wet, invertebrate-rich climates to over 200 days in cold dry climates. Typical defaults are 90–150 days for white-tailed deer in temperate North America, 30–60 days for tropical environments, and 150–250 days for boreal or alpine sites.
What plot size should I use?
Common plot sizes are 1 m², 4 m² (2 m × 2 m), or 100 m² circular plots. Larger plots reduce zero-counts and improve statistical efficiency in low-density areas but cost more search time per plot. Choose plot size to expect 3–10 pellet groups per plot on average.
Can FSC work for elephants and other large mammals?
Yes — FSC is widely applied to elephants, deer, elk, koalas, hares and most large herbivores. Each species needs its own defecation rate (from captive or wild studies) and habitat-specific decay constant. African forest elephant surveys, for example, use FSC dung-pile counts as a continental standard.
Is FSC accurate without detection-probability correction?
FSC density estimates without observer detection correction may underestimate true density by 20–50%, especially in dense vegetation. Modern best practice adjusts for detection using double-observer protocols, mark-resight pellet placement experiments, or scat detection dogs which raise detection probability to 70–90%.
What units does the FSC tool output?
This calculator outputs animals per km², per hectare, and per 100 ha so users can compare directly to published density values from US (deer/mi² often converts to deer/km²), European (deer/100 ha standard) and Indian wildlife studies. Switch units in the output dropdown.
📚 References
The following references support the methods used in this Faecal Standing Crop (FSC) calculator, covering pellet group count methodology, wildlife density estimation, and best practices in indirect wildlife survey design.
- Bennett, L. J., English, P. F., & McCain, R. (1940). A study of deer populations by use of pellet-group counts. The Journal of Wildlife Management, 4(4), 398–403. https://doi.org/10.2307/3796010
- Eberhardt, L. L., & Van Etten, R. C. (1956). Evaluation of the pellet-group count as a deer census method. The Journal of Wildlife Management, 20(1), 70–74. https://doi.org/10.2307/3797250
- Neff, D. J. (1968). The pellet-group count technique for big game trend, census, and distribution: A review. The Journal of Wildlife Management, 32(3), 597–614. https://doi.org/10.2307/3798941
- Putman, R. J. (1984). Facts from faeces. Mammal Review, 14(2), 79–97. https://doi.org/10.1111/j.1365-2907.1984.tb00341.x
- Campbell, D., Swanson, G. M., & Sales, J. (2004). Methodological insights: Comparing the precision and cost-effectiveness of faecal pellet group count methods. Journal of Applied Ecology, 41(6), 1185–1196. https://doi.org/10.1111/j.0021-8901.2004.00964.x
- Marques, F. F. C., Buckland, S. T., Goffin, D., Dixon, C. E., Borchers, D. L., Mayle, B. A., & Peace, A. J. (2001). Estimating deer abundance from line transect surveys of dung: Sika deer in southern Scotland. Journal of Applied Ecology, 38(2), 349–363. https://doi.org/10.1046/j.1365-2664.2001.00584.x
- Mayle, B. A., Peace, A. J., & Gill, R. M. A. (1999). How many deer? A field guide to estimating deer population size. Forestry Commission Field Book 18. Forestry Commission, Edinburgh. forestresearch.gov.uk
- Smart, J. C. R., Ward, A. I., & White, P. C. L. (2004). Monitoring woodland deer populations in the UK: An imprecise science. Mammal Review, 34(1‑2), 99–114. https://doi.org/10.1046/j.0305-1838.2003.00026.x
- Acevedo, P., Ferreres, J., Jaroso, R., Durán, M., Escudero, M. A., Marco, J., & Gortázar, C. (2010). Estimating roe deer abundance from pellet group counts in Spain: An assessment of methods suitable for Mediterranean woodlands. Ecological Indicators, 10(6), 1226–1230. https://doi.org/10.1016/j.ecolind.2010.04.006
- Mandujano, S. (2014). PELLET: An Excel-based procedure for estimating deer population density using the pellet-group counting method. Tropical Conservation Science, 7(2), 308–323. https://doi.org/10.1177/194008291400700210
- Morini, P., Vogliotti, A., Polo, V., Costa-Pereira, R., & Duarte, J. M. B. (2024). Faecal Standing Crop with real-time correction using scat detection dogs to estimate population density. Journal of Applied Ecology, 61(6), 1247–1259. https://doi.org/10.1111/1365-2664.14658
- Rhodes, J. R., Hood, A., Melzer, A., & Mucci, A. (2015). Estimating long-term trends in koala abundance from indirect signs. PLOS ONE, 10(2), e0117251. https://doi.org/10.1371/journal.pone.0117251
- Forsyth, D. M., Barker, R. J., Morriss, G., & Scroggie, M. P. (2007). Modeling the relationship between fecal pellet indices and deer density. The Journal of Wildlife Management, 71(3), 964–970. https://doi.org/10.2193/2005-695
- Buckland, S. T., Anderson, D. R., Burnham, K. P., Laake, J. L., Borchers, D. L., & Thomas, L. (2001). Introduction to distance sampling: Estimating abundance of biological populations. Oxford University Press. global.oup.com
- R Core Team. (2024). R: A language and environment for statistical computing. R Foundation for Statistical Computing. https://www.R-project.org/


