Economic Loss Estimator
Quantify the monetary cost of wildlife damage — crop raiding, livestock depredation, and human-wildlife conflict losses (USD)
📊 Data Input
0 values entered
| Household ID | Loss (USD) | Action |
|---|
⚙️ Analysis Configuration
📊 Distribution of Losses (Histogram)
📉 Loss per Household (Bar)
🥧 Loss Severity Tiers (Pie)
📈 Cumulative Loss Curve (Lorenz)
Economic Loss Estimator Equation
The total economic loss (LT) and mean loss per household (L̄) are calculated as:
- LT: Total economic loss summed across all households (USD)
- Li: Loss reported by household i (USD)
- L̄: Mean economic loss per household (USD)
- n: Number of households surveyed
- SD: Standard deviation of losses across households
- SE: Standard error of the mean — precision of the estimate
- Σ: The sum across all surveyed households
📋 Full Results Table
🏆 Highest & Lowest Loss Households
Identify the top-loss households for priority compensation, and the lowest-loss households for benchmark comparison.
📊 Frequency Distribution Table
Count of households falling within each loss range, with cumulative frequencies and percentages.
💼 Economic Vulnerability Analysis
Loss-to-income comparisons against rural USA benchmarks, recovery time estimates, and compensation budget projections.
💰 Compensation Budget Scenarios
What it would cost to compensate affected households at different reimbursement rates and targeting strategies.
🧪 Hypothesis Tests
Statistical tests for normality and whether mean loss differs significantly from key benchmarks.
📖 Plain-Language Interpretation
Subsection 1 — Interpretation Results
Subsection 2 — How to Write Your Results in Research
Six ready-to-use templates auto-filled with your computed values. Click 📋 Copy on any card to copy the text.
🔍 Detailed Conclusion
🔬 Technical Notes — Formula Derivation, Assumptions & Limitations
Extended Formula Derivation
The Economic Loss Estimator integrates three core wildlife economics formulas:
(1) Total loss: LT = Σᵢ₌₁ⁿ Lᵢ
(2) Mean loss: L̄ = (1/n) · Σ Lᵢ
(3) Variance: σ² = (1/(n−1)) · Σ (Lᵢ − L̄)²
(4) 95% CI: L̄ ± 1.96 · (SD / √n)
(5) Per-hectare extrapolation: Lha = L̄ / mean_area
(6) Regional projection: Lregion = L̄ · Nhouseholds
Assumptions
- Reported losses are accurate self-reports from affected households
- Market prices used reflect the survey year (CPI-adjustable)
- Households are independently sampled (no double-counting)
- Distribution may be right-skewed; report median alongside mean
- Losses are direct only unless explicitly noted
Limitations
- Self-reported damage may be inflated for compensation claims
- Indirect costs (labor, opportunity cost, stress) are not captured
- Single-season estimates may not capture inter-annual variability
- Market price volatility can shift loss values across years
- Spatial heterogeneity within a study area is masked by averaging
✅ When to Use This Tool
Decision Checklist
✓ You have monetary loss values per household from wildlife damage
✓ You want to estimate average and total losses for a region or season
✓ Loss values are in a single currency (USD recommended)
✓ You need a publication-ready estimate for a conflict report or journal
✗ Do NOT use if losses are non-monetary (use injury counts or qualitative scales)
✗ Do NOT use if currencies are mixed without conversion
✗ Do NOT use for ecological diversity — use Shannon-Wiener instead
Real-World USA Examples
- Iowa Corn Belt — White-tailed deer crop damage across 120 farms, mean loss $530/household, scaled to county level for state compensation pool
- Wyoming Wolf Recovery Zone — Cattle depredation losses on private ranches; informs Defenders of Wildlife compensation payments
- Florida Citrus Industry — Feral hog damage to grove infrastructure and root systems, USDA APHIS economic assessment
- Yellowstone Greater Ecosystem — Grizzly bear apiary, livestock and orchard losses; basis for IGBC compensation framework
Sampling Design Guidance
- Minimum 30 households for stable mean estimates; 100+ for regional extrapolation
- Stratify by farm size, distance to wildlife habitat, and crop/livestock type
- Use recall windows of 12 months maximum to limit memory bias
- Cross-validate with extension agent or insurance records when available
Related Metrics — Decision Tree
Need monetary loss summary? → Economic Loss Estimator (this tool)
→ Want to compare across communities? → Mean per-household loss + 95% CI
→ Want regional projection? → Multiply by N households at risk
Need conflict frequency only? → Conflict Incident Rate calculator
Need wildlife population estimate? → Mark-recapture / Density calculator
Need crop damage area? → Area-Based Damage Assessment
📘 How to Use This Tool — Step-by-Step
- Enter Your Data — Use the Type/Paste tab for comma-separated USD loss values (e.g., "520, 480, 750, 610, 440") collected via household survey or insurance claim records.
- Choose a Sample Dataset — Five USA-based examples are pre-loaded covering deer crop damage, wolf depredation, hog damage, grizzly conflict, and coyote predation.
- Configure Analysis Settings — Enter the study area name (e.g., "Park County, Wyoming"), species, loss type, survey year, and total households at risk for regional extrapolation.
- Run the Analysis — Click "Calculate Economic Loss" to compute mean, median, total, regional projection, 95% CI, and inequality metrics.
- Read the Summary Cards — Mean loss per household, total loss, regional projection, and severity tier (HIGH/MODERATE/LOW) are displayed with traffic-light coloring.
- Read the Full Results Table — A grouped 9-section table covering Sample & Totals (n, total surveyed loss, regional projection, severity tier), Central Tendency (mean, median, mode, geometric & harmonic mean, trimmed means, midrange), Dispersion & Variability (range, variance, SD, SE, CV, MAD, robust SD, dispersion index), Confidence Intervals (90/95/99% for mean and median), Percentiles (P5, P10, Q1, P50, Q3, P90, P95, P99, IQR), Outlier Detection (Tukey fences, extreme fences, z-score outliers), Distribution Shape (skewness, kurtosis, normality check), Inequality & Concentration (Gini, Theil, Atkinson, top-10/20/bottom-50 shares, Palma, 80/20 Pareto ratio), and Severity Tier Counts.
- Examine the Four Visualizations — Histogram (distribution shape), bar chart (per-household), pie (severity tiers), and Lorenz curve (loss inequality).
- Read the Detailed Interpretation — Five paragraphs explaining what the values mean for park managers, journal reviewers, and policy advisors.
- Copy a Reporting Template — Six ready-to-paste templates for journals, theses, policy briefs, conferences, monitoring reports, and conference posters.
- Export Your Results — Download the Doc (text) or PDF (print-ready) for archival, peer review, or grant submission.
❓ Frequently Asked Questions (FAQ)
What is an economic loss estimator in wildlife research?
How is wildlife economic loss calculated?
What is the average crop loss from wildlife damage in the USA?
Why use USD per household for wildlife loss estimation?
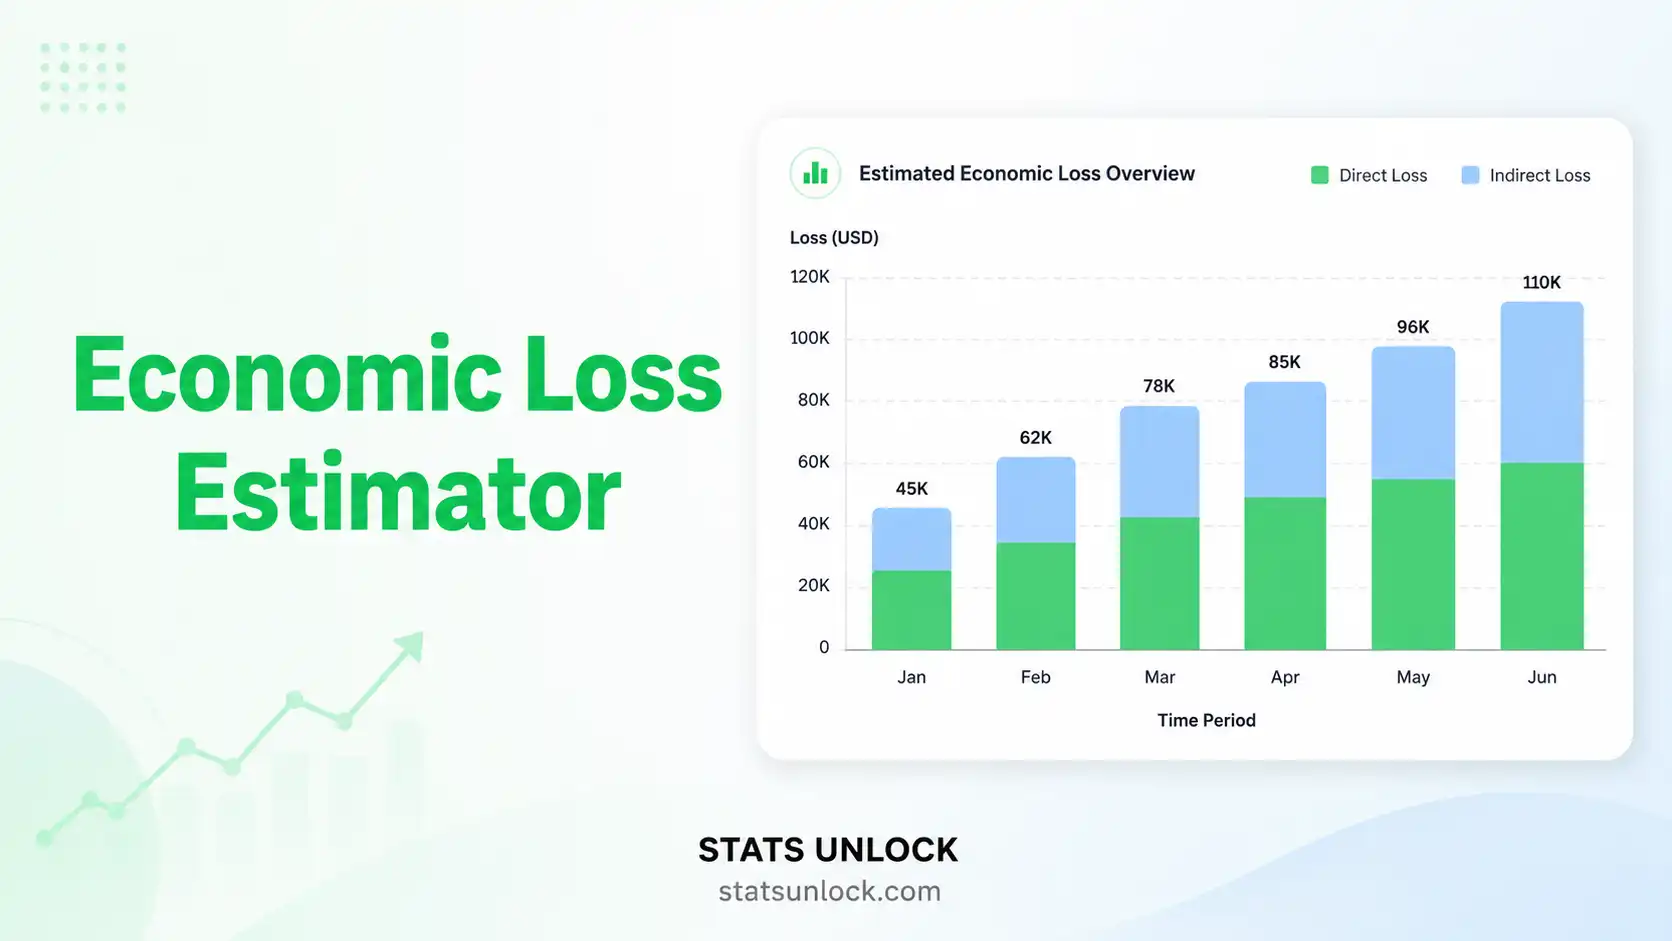
What is the difference between direct and indirect wildlife economic loss?
Why include the Gini coefficient for economic losses?
How do I report wildlife economic loss in a journal?
Can I compare losses between two USA states using this tool?
Does this tool account for inflation or year-over-year price changes?
What software do USA wildlife agencies use for economic loss assessment?
📚 References
The following references support the methods used in this economic loss estimator for wildlife damage assessment, covering human-wildlife conflict economics, crop raiding loss, and livestock depredation cost estimation methodology.
- Conover, M. R. (2002). Resolving human-wildlife conflicts: The science of wildlife damage management. CRC Press. https://doi.org/10.1201/9781420032581
- USDA APHIS Wildlife Services. (2023). Annual program data report — Wildlife damage management. United States Department of Agriculture. https://www.aphis.usda.gov/aphis/ourfocus/wildlifedamage
- Naughton-Treves, L., Grossberg, R., & Treves, A. (2003). Paying for tolerance: Rural citizens' attitudes toward wolf depredation and compensation. Conservation Biology, 17(6), 1500–1511. https://doi.org/10.1111/j.1523-1739.2003.00060.x
- Pimentel, D., Zuniga, R., & Morrison, D. (2005). Update on the environmental and economic costs associated with alien-invasive species in the United States. Ecological Economics, 52(3), 273–288. https://doi.org/10.1016/j.ecolecon.2004.10.002
- Anderson, A., Slootmaker, C., Harper, E., Holderieath, J., & Shwiff, S. A. (2016). Economic estimates of feral swine damage and control in 11 US states. Crop Protection, 89, 89–94. https://doi.org/10.1016/j.cropro.2016.06.023
- DeNicola, A. J., VerCauteren, K. C., Curtis, P. D., & Hygnstrom, S. E. (2000). Managing white-tailed deer in suburban environments: A technical guide. Cornell Cooperative Extension. https://ecommons.cornell.edu/handle/1813/65
- Treves, A., & Karanth, K. U. (2003). Human-carnivore conflict and perspectives on carnivore management worldwide. Conservation Biology, 17(6), 1491–1499. https://doi.org/10.1111/j.1523-1739.2003.00059.x
- Madden, F. (2004). Creating coexistence between humans and wildlife: Global perspectives on local efforts to address human-wildlife conflict. Human Dimensions of Wildlife, 9(4), 247–257. https://doi.org/10.1080/10871200490505675
- Dickman, A. J., Macdonald, E. A., & Macdonald, D. W. (2011). A review of financial instruments to pay for predator conservation and encourage human-carnivore coexistence. PNAS, 108(34), 13937–13944. https://doi.org/10.1073/pnas.1012972108
- Bureau of Labor Statistics. (2024). Consumer Price Index inflation calculator. U.S. Department of Labor. https://www.bls.gov/data/inflation_calculator.htm
- Barua, M., Bhagwat, S. A., & Jadhav, S. (2013). The hidden dimensions of human-wildlife conflict: Health impacts, opportunity and transaction costs. Biological Conservation, 157, 309–316. https://doi.org/10.1016/j.biocon.2012.07.014
- Ravenelle, J., & Nyhus, P. J. (2017). Global patterns and trends in human-wildlife conflict compensation. Conservation Biology, 31(6), 1247–1256. https://doi.org/10.1111/cobi.12948
- R Core Team. (2024). R: A language and environment for statistical computing. R Foundation for Statistical Computing. https://www.R-project.org/
- USFWS. (2023). Working lands for wildlife — Compensation programs. U.S. Fish and Wildlife Service. https://www.fws.gov/program/working-lands-wildlife
- White, P. C. L., & Ward, A. I. (2010). Interdisciplinary approaches for the management of existing and emerging human-wildlife conflicts. Wildlife Research, 37(8), 623–629. https://doi.org/10.1071/WR10191


