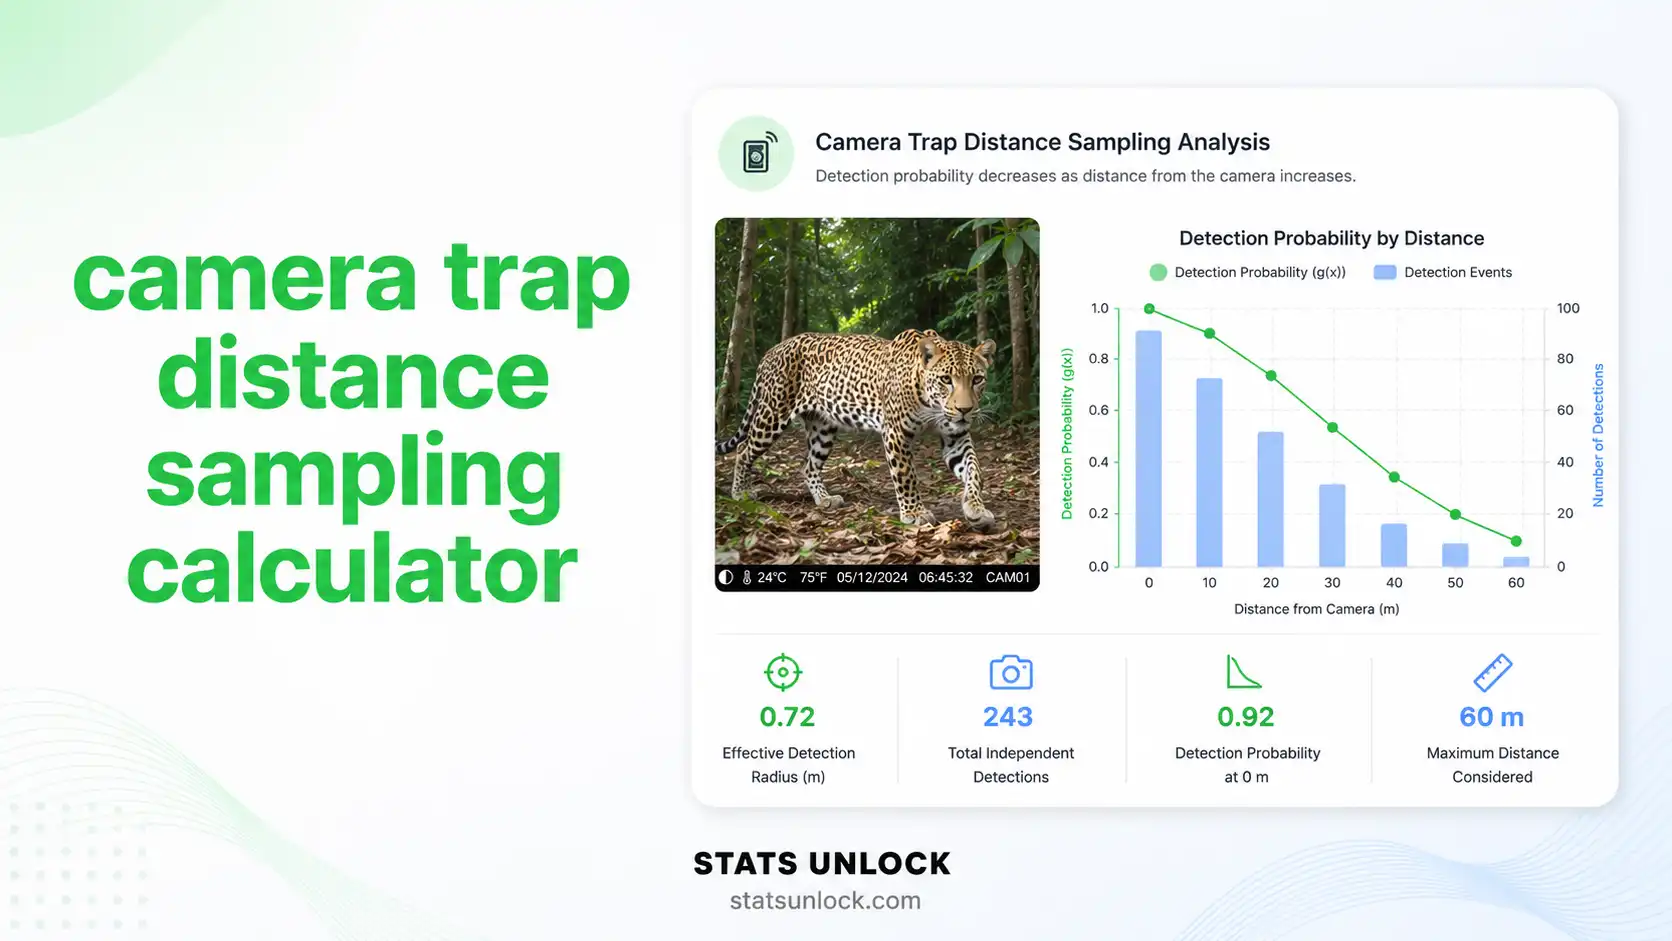
Camera Trap Distance Sampling (CTDS) Calculator
Estimate absolute wildlife population density (animals/km²) from camera trap distance sampling data — supports single-species and multi-species analysis, detection function fitting, and publication-ready reporting.
📐 Camera Trap Distance Sampling — Geometry & Measurements
The diagram below shows the geometric setup of one camera trap and how each measurement contributes to the density estimate. It updates automatically when you change the truncation distance w or camera viewshed angle θ in the Analysis Configuration panel.
Top-down view of one camera's detection zone. The animal is detected at distance r, measured using vegetation distance markers placed at known intervals (1, 2, 5, 10 m). The shaded green sector is the viewshed of area a = ½ × θ × w².
📥 1. Data Input
0 valid distances detected
Supports .csv, .txt, .xlsx, .xls — headers detected automatically. Column picker appears below.
Single species: choose one distance column. Multi-species: pick one column per species (header text becomes the species name).
| # | Distance (m) |
|---|
⚙️ 2. Analysis Configuration
Independent-event window in seconds (typical: 60–300 s). Defines what counts as a separate detection.
Average number of animals per detection event. Use 1 for solitary species (e.g., panther, leopard, lone bear). Use the observed mean (e.g., 2.4 for elk, 1.8 for white-tailed deer, 3.0 for bighorn sheep) for group-living species. CTDS counts groups, so Ē(g) scales the result to individuals via the formula D̂ = (n × Ē(g)) / (e × a × p̂).
Half-Normal is the default for camera trap data. Auto-Select fits all models and picks the lowest AIC.
Density estimate (D̂) will be reported in this unit throughout the results, charts, and downloads.
CTDS Density Equation (Howe et al., 2017)
The Camera Trap Distance Sampling density estimator is:
- D̂: Density (D̂) - Animals/km² (the estimated population density)
- n: Number of detections within truncation distance w
- Ē(g): Mean group (cluster) size
- e: Total sampling effort (number of independent snapshot moments = total camera-seconds ÷ snapshot interval)
- a: Area of camera viewshed sector (km²) at truncation distance
- w: Truncation distance (m) — max distance retained
- θ: Camera horizontal field-of-view angle (radians)
- p̂: Estimated detection probability from the detection function
📊 Visualizations
📋 Detailed Results Table
🔬 3. Methodology
🧠 4. Plain-Language Interpretation
▸ Interpretation Results
▸ How to Write Your Results in Research
▸ Research Poster Panel
🔬 Technical Notes — Formula Derivation, Assumptions & Limitations
📌 When to Use CTDS — Decision Checklist & Examples
🔍 Conclusion
▶ Run the analysis above to generate a personalised conclusion for your dataset.
❓ Frequently Asked Questions
📖 How to Use This CTDS Calculator — Step by Step
📚 References
The following references support the statistical and ecological methods used in this Camera Trap Distance Sampling (CTDS) calculator, covering wildlife density estimation, detection function modelling, and best practices in camera trap survey design.


