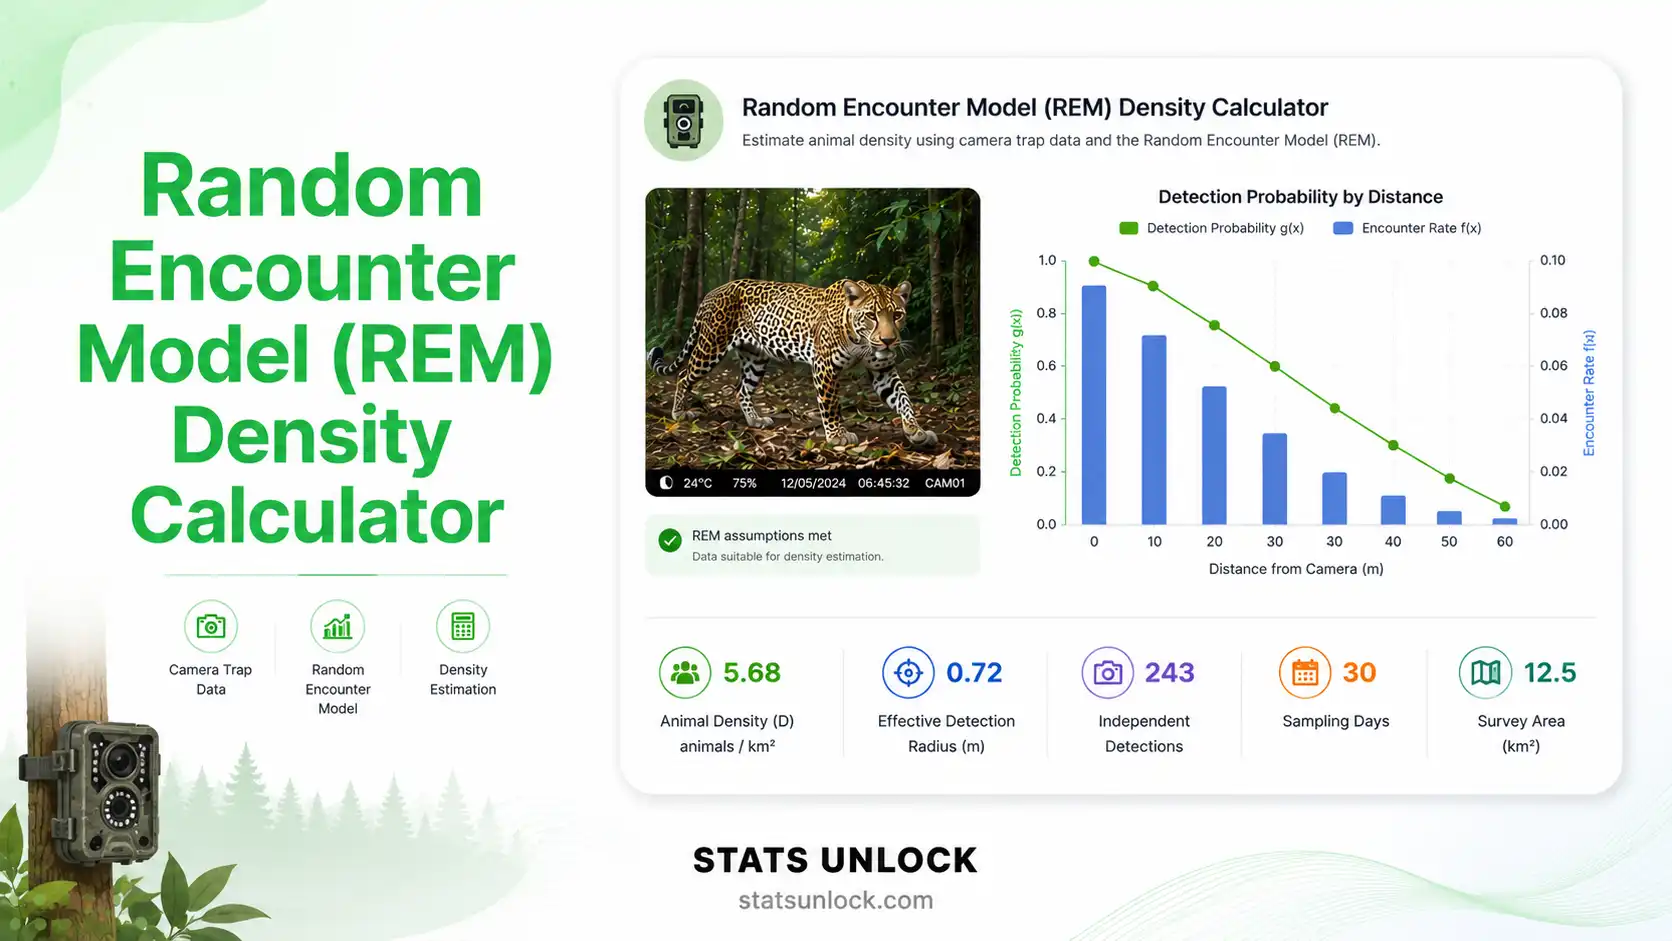
Random Encounter Model (REM) Density Calculator
Estimate absolute wildlife population density (animals/km²) from camera trap data using the Rowcliffe et al. (2008) Random Encounter Model — no individual identification required, supports single and multi-species analysis with day-range speed input.
📐 Random Encounter Model — Geometry & Measurements
The diagram below shows the REM detection geometry: the camera's detection zone, the effective detection radius r, the viewshed angle θ, and an animal moving through the zone at mean speed v. Updates live as you change config inputs.
The REM treats animals as randomly-moving "gas particles" and uses their movement speed (day range) plus the camera's detection profile (r, θ) to infer density from raw encounter rate y/t.
📥 1. Data Input
Enter at least 3 detection distances (in metres), one value per animal sighting. Each value = one independent detection. Single-value entries are not valid REM input.
Supports .csv, .txt, .xlsx, .xls — expects two columns: species name + detection count (per camera or per species).
| # | Detection Label / ID | Distance (m) |
|---|
⚙️ 2. Analysis Configuration
Mean daily distance travelled by the species (its "day range"). Typical values: deer 4–8 km/day, wolves 10–25, lions 6–10, elephants 8–15, small mammals 0.3–1.5, large herbivores (wildebeest, zebra) 10–20.
Average distance at which the camera reliably detects the target species. Deer-sized: 8–15 m; large carnivores: 10–20 m; small mammals: 3–8 m. Measure in the field or use published species-specific values.
Hours per day the cameras are active (24 for always-on; lower if scheduled).
Average number of animals per detection event. Use 1 for solitary species. Use observed mean (e.g., 5.2 for wildebeest, 3.8 for elephant herds) for group-living species.
📊 Results
REM Density Equation (Rowcliffe et al., 2008)
- D̂: Density (D̂) - Animals per output unit
- y: Total number of independent detections
- t: Total survey time (camera-days)
- v: Mean daily animal speed / day range (km/day)
- r: Effective detection radius (km)
- θ: Camera viewshed angle (radians)
- Ē(g): Mean group size
📊 Visualizations
📋 Detailed Results Table
🔬 3. Methodology
🧠 4. Plain-Language Interpretation
▸ Interpretation Results
▸ How to Write Your Results in Research
▸ Research Poster Panel
🔬 Technical Notes — Formula Derivation, Assumptions & Limitations
📌 When to Use REM — Decision Checklist & Examples
🔍 Conclusion
What Was Found
Ecological Significance
Conservation Implications
Next Steps
❓ Frequently Asked Questions
📖 How to Use This REM Calculator — Step by Step
📚 References
Key peer-reviewed sources on the Random Encounter Model, camera trap density estimation, and animal movement ecology.


