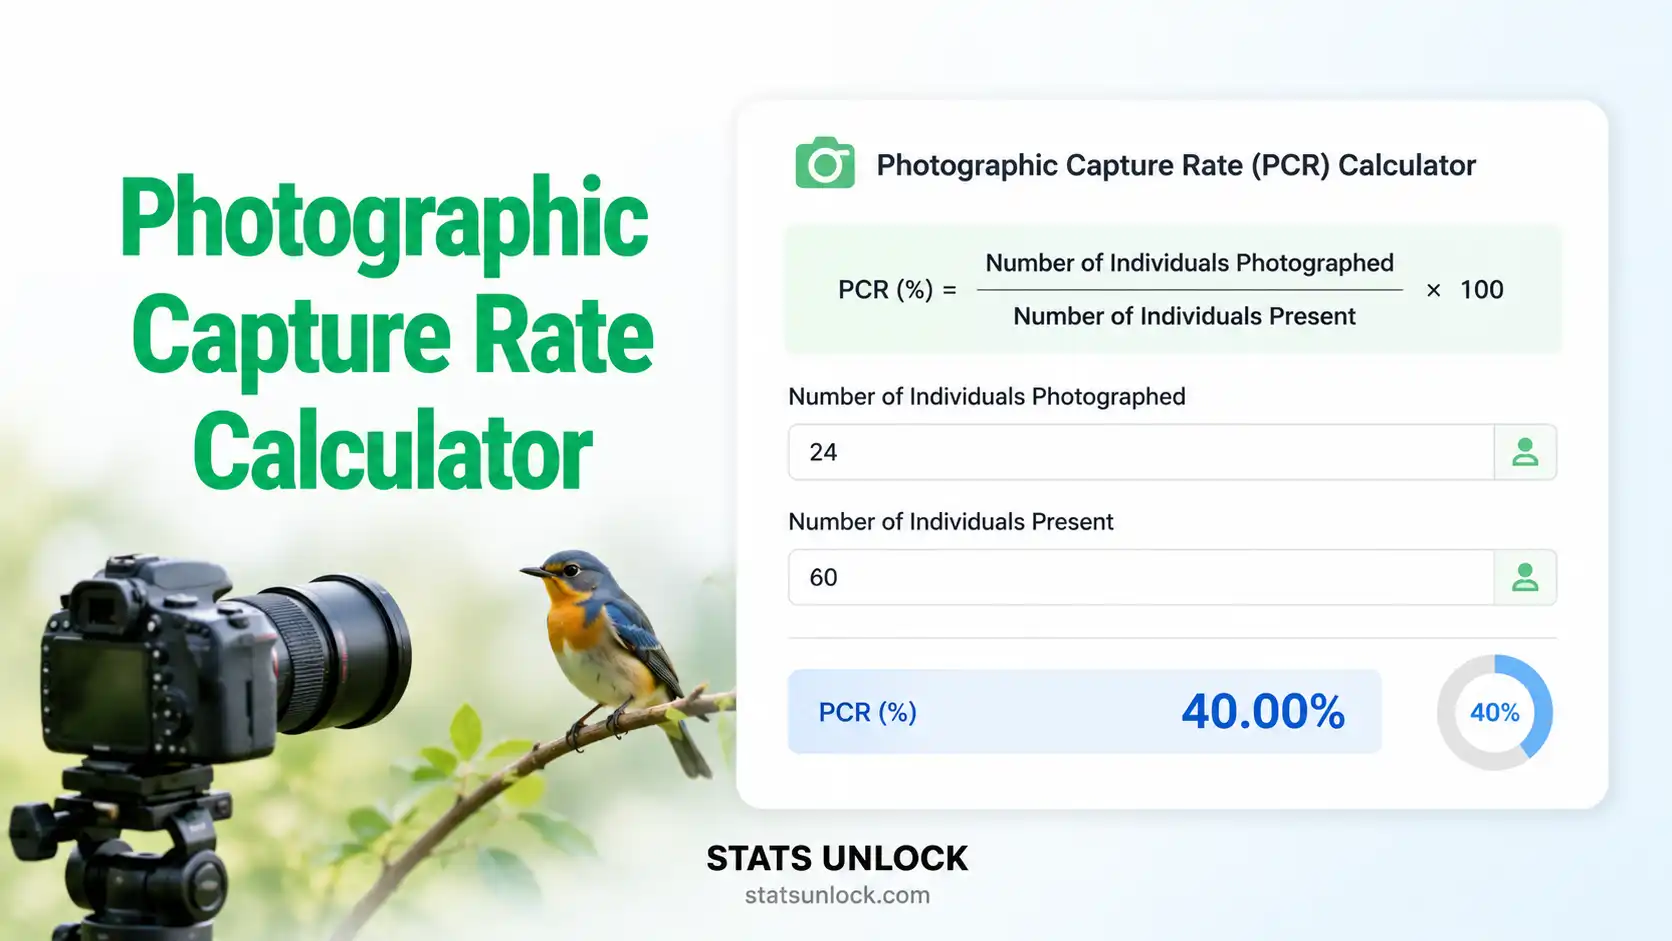
Photographic Capture Rate Calculator
Free online camera trap & wildlife detection analysis tool. Calculate Photographic Capture Rate (PR) per 1,000 trap-nights with charts, interpretation, and publication-ready output.
📥 Data Input
Number of active trap-nights at each unit (camera/station/period).
Enter the number of photographs at each unit (camera station, site, or sampling period). Default separator: comma. Newlines also accepted.
Click or drag a file here
Accepts .csv, .txt, .xlsx, .xls — first row treated as headers
Edit cells directly. Use + Add Row to extend the table or × to remove a row.
| # | Station / Label | Photographs | Trap-Nights | Action |
|---|
📊 Results Summary
- PR = Photographic Capture Rate (photographs per 1,000 trap-nights)
- Total Photographs = Σ all photographs across stations/units (not filtered for independence)
- Total Trap-Nights = Σ active camera-days across all stations
- × 1,000 = scaling factor for inter-study comparability (standard ecological convention)
📊 Photographs per Unit
🎯 Photographic Rate per Unit (per 1,000 TN)
📈 Cumulative Photographs
🍩 Capture Rate Category Distribution
📋 Detailed Results Table
📐 Descriptive Statistics
Full statistical summary of per-unit Photographic Capture Rate values.
🎯 Detection & Occupancy Metrics
Additional camera-trap metrics derived from your dataset — naïve occupancy, detection frequency, and inequality of detections across stations.
🏆 Top & Bottom Performing Units
🟢 Top 3 Highest PR
🔴 Bottom 3 Lowest PR
🔍 Outlier Analysis
Outliers identified using Tukey's fences (1.5 × IQR method). Units flagged here represent statistically unusual detection rates and may warrant separate ecological interpretation.
✅ Data Quality & Sampling Adequacy
🧠 Interpretation of Results
📝 How to Write Your Results in Research
Five publication-ready example sentences for reporting your Photographic Capture Rate results. Copy each to clipboard with one click.
🪧 Research Poster Panel
🎯 Detailed Conclusion
⚙️ Technical Notes & Assumptions
📐 Full Formula Derivation
The Photographic Capture Rate (PR) standardises raw photograph counts by sampling effort, making capture rates comparable across studies with different trap-night totals:
PR = (Σ Photographs / Σ Trap-Nights) × 1,000
Where 1 trap-night = 1 camera operating for 1 full 24-hour period. If a camera operates 30 days, that contributes 30 trap-nights. Total trap-nights across the study = Σ (active days per camera).
Unlike the Relative Abundance Index (RAI), PR does not filter for independent events — all photographs count, including consecutive triggers of the same individual. This makes PR more sensitive to detection effort but less comparable across species with different behaviours.
📋 Key Assumptions
- Equal trap effort. Each camera-night is treated as one independent sampling unit.
- Constant detection probability across stations. Differences in vegetation, camera model, or sensor sensitivity should be minimal or controlled.
- Photographs are not filtered for independence. PR reflects total trigger frequency rather than independent visit events.
- Camera malfunctions are excluded from trap-night totals (only active days count).
- Comparison is within-study. PR values are most meaningful when comparing sites, habitats, or seasons within the same camera-trap protocol.
⚠️ Common Limitations
- PR is sensitive to species behaviour — slow-moving or social species generate inflated photograph counts.
- PR is not a direct estimate of density or abundance; it is a relative index.
- Camera placement bias (along trails vs. random) systematically affects PR magnitudes.
- Differences in trigger sensitivity, delay settings, and burst mode across studies make absolute PR values incomparable without protocol standardisation.
✅ When to Use Photographic Capture Rate
Use PR when:
- ✓ Comparing camera trigger frequency across sites, habitats, or seasons within the same study.
- ✓ Documenting raw activity at a station (e.g., total wildlife use of a trail).
- ✓ Reporting effort-corrected photograph counts in monitoring programs.
- ✓ Standardising across cameras that ran for different durations.
Avoid PR when:
- ✗ You need a true abundance or density estimate — use SECR or occupancy models instead.
- ✗ Comparing across studies with different camera models, delay settings, or trail placement bias.
- ✗ You want event-level activity — use RAI (filters for independence) instead.
Real-world examples: Yellowstone wolf monitoring (USA), Great Smoky Mountains black bear surveys (USA), Everglades panther recovery program (USA), and Olympic NP elk activity tracking (USA) all routinely report PR per 1,000 trap-nights for inter-site comparisons.
📚 How to Use This Calculator
- Enter your Study Area / Site Name (optional but recommended — will auto-fill in reports and the poster).
- Set the Group / Species / Category Name (e.g., "Camera Stations" or "Yellowstone Stations").
- Enter the average trap-nights per unit. If trap-nights vary between cameras, use the Column Entry mode for per-station values.
- Choose an input method: paste comma-separated photograph counts, upload a CSV/Excel file, or fill the manual table.
- Click ▶ Run Analysis.
- Review the four visualisation charts and detailed results table.
- Read the auto-generated Interpretation for your data.
- Copy publication-ready sentences from How to Write Your Results.
- Use the Research Poster Panel for conference templates.
- Download the report as DOC or PDF for archives.
❓ Frequently Asked Questions
What is Photographic Capture Rate (PR)?
Photographic Capture Rate is a camera-trap effort-corrected index calculated as the total number of photographs divided by total trap-nights, expressed per 1,000 trap-nights. It standardises raw photo counts by sampling effort.
What is the difference between PR and RAI?
RAI (Relative Abundance Index) filters photographs to independent events (typically ≥30 min apart) and is expressed per 100 trap-nights. PR uses all photographs and is expressed per 1,000 trap-nights. PR is more sensitive to detection effort; RAI is closer to a relative abundance index.
Why multiply by 1,000?
Multiplying by 1,000 produces interpretable numbers (most camera-trap photograph rates are very small per single trap-night). The 1,000 factor is the global ecological convention for PR. RAI uses ×100 instead.
Is PR a measure of abundance?
No. PR is a relative index — useful for within-study comparisons but not a direct measure of density. For true abundance or density estimates, use spatial capture-recapture (SECR) or occupancy modelling.
How many trap-nights do I need?
Most wildlife camera-trap studies recommend a minimum of 600–1,000 trap-nights per site, but the actual number depends on target species detectability. Rare species require > 2,000 trap-nights for reliable detection.
Can I compare PR between studies?
Only with caution. PR is sensitive to camera placement (trail vs. random), trigger settings, and delay intervals. Studies must use comparable protocols for between-study comparison to be meaningful.
Should I exclude malfunction days from trap-nights?
Yes. Trap-nights should reflect only actively functioning camera days. Cameras out-of-service, with dead batteries, or knocked over should be subtracted from the trap-night total.
What counts as a "photograph"?
Any image triggered by a camera's motion sensor that contains a target species. Burst-mode photographs of the same trigger event are typically counted individually for PR (but only once for RAI).
How do I report PR in a manuscript?
Standard format: "Photographic Capture Rate (PR) = X.XX photographs per 1,000 trap-nights (Σ trap-nights = N)." Always include the total trap-night effort and per-unit breakdown in a supplementary table.
Can I use PR for camera traps targeting multiple species?
Yes — calculate PR separately for each target species using the same total trap-night denominator. This produces a comparable per-1,000-trap-night rate for each species.
📖 References
Peer-reviewed sources on photographic capture rate, camera trap analysis, and wildlife detection methods in ecology and biodiversity research:
- O'Connell, A. F., Nichols, J. D., & Karanth, K. U. (2011). Camera Traps in Animal Ecology: Methods and Analyses. Springer. https://link.springer.com/book/10.1007/978-4-431-99495-4
- Rovero, F., & Zimmermann, F. (2016). Camera Trapping for Wildlife Research. Pelagic Publishing. https://pelagicpublishing.com/products/camera-trapping-for-wildlife-research
- Burton, A. C., Neilson, E., Moreira, D., Ladle, A., Steenweg, R., Fisher, J. T., Bayne, E., & Boutin, S. (2015). Wildlife camera trapping: a review and recommendations for linking surveys to ecological processes. Journal of Applied Ecology, 52(3), 675–685. https://doi.org/10.1111/1365-2664.12432
- Kays, R., Arbogast, B. S., Baker-Whatton, M., Beirne, C., Boone, H. M., Bowler, M., et al. (2020). An empirical evaluation of camera trap study design: How many, how long and when? Methods in Ecology and Evolution, 11(6), 700–713. https://doi.org/10.1111/2041-210X.13370
- Sollmann, R., Mohamed, A., Samejima, H., & Wilting, A. (2013). Risky business or simple solution – Relative abundance indices from camera-trapping. Biological Conservation, 159, 405–412. https://doi.org/10.1016/j.biocon.2012.12.025
- MacKenzie, D. I., Nichols, J. D., Lachman, G. B., Droege, S., Royle, J. A., & Langtimm, C. A. (2002). Estimating site occupancy rates when detection probabilities are less than one. Ecology, 83(8), 2248–2255. https://doi.org/10.1890/0012-9658(2002)083[2248:ESORWD]2.0.CO;2
- Karanth, K. U. (1995). Estimating tiger Panthera tigris populations from camera-trap data using capture-recapture models. Biological Conservation, 71(3), 333–338. https://doi.org/10.1016/0006-3207(94)00057-W
- Steenweg, R., Hebblewhite, M., Kays, R., Ahumada, J., Fisher, J. T., Burton, A. C., et al. (2017). Scaling up camera traps: monitoring the planet's biodiversity with networks of remote sensors. Frontiers in Ecology and the Environment, 15(1), 26–34. https://doi.org/10.1002/fee.1448
- Meek, P. D., Ballard, G., Claridge, A., Kays, R., Moseby, K., O'Brien, T., et al. (2014). Recommended guiding principles for reporting on camera trapping research. Biodiversity and Conservation, 23(9), 2321–2343. https://doi.org/10.1007/s10531-014-0712-8
- Wearn, O. R., & Glover-Kapfer, P. (2019). Snap happy: camera traps are an effective sampling tool when compared with alternative methods. Royal Society Open Science, 6(3), 181748. https://doi.org/10.1098/rsos.181748
- Ahumada, J. A., Hurtado, J., & Lizcano, D. (2013). Monitoring the status and trends of tropical forest terrestrial vertebrate communities from camera trap data: a tool for conservation. PLoS ONE, 8(9), e73707. https://doi.org/10.1371/journal.pone.0073707
- Caravaggi, A., Banks, P. B., Burton, A. C., Finlay, C. M. V., Haswell, P. M., Hayward, M. W., et al. (2017). A review of camera trapping for conservation behaviour research. Remote Sensing in Ecology and Conservation, 3(3), 109–122. https://doi.org/10.1002/rse2.48
- Tobler, M. W., Carrillo-Percastegui, S. E., Leite Pitman, R., Mares, R., & Powell, G. (2008). An evaluation of camera traps for inventorying large- and medium-sized terrestrial rainforest mammals. Animal Conservation, 11(3), 169–178. https://doi.org/10.1111/j.1469-1795.2008.00169.x
- Cusack, J. J., Dickman, A. J., Rowcliffe, J. M., Carbone, C., Macdonald, D. W., & Coulson, T. (2015). Random versus game trail-based camera trap placement strategy for monitoring terrestrial mammal communities. PLoS ONE, 10(5), e0126373. https://doi.org/10.1371/journal.pone.0126373
- Rowcliffe, J. M., Field, J., Turvey, S. T., & Carbone, C. (2008). Estimating animal density using camera traps without the need for individual recognition. Journal of Applied Ecology, 45(4), 1228–1236. https://doi.org/10.1111/j.1365-2664.2008.01473.x


