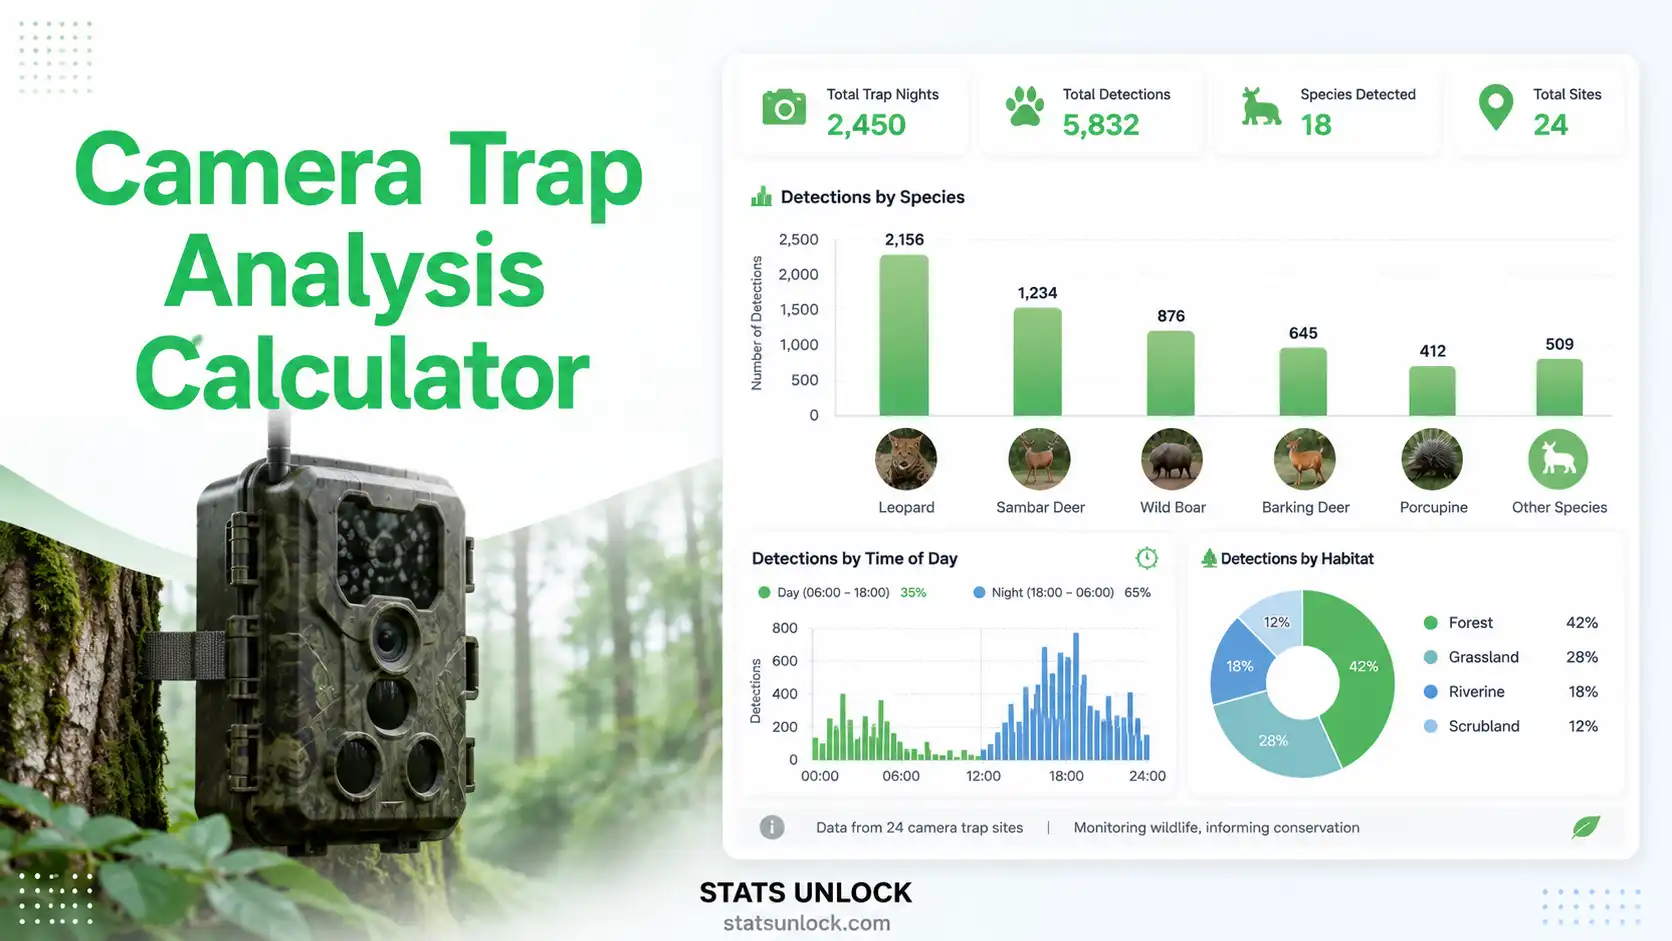
🎥 Camera Trap Analysis Calculator
Calculate RAI, detection rate, photographic rate, diel activity patterns, and species richness from camera trap data — free online wildlife analysis tool
📋 Enter Camera Trap Data
5 species detected
5 values entered
📂
Click to upload or drag & drop
Supports .csv, .txt, .xlsx, .xls — headers detected automatically
Enter species data row by row. All fields optional except Species Name and Detections.
| Species | Detections | Peak Hour |
|---|
⚙️ Analysis Configuration
Total camera × operating days
Default 30 min between detections
420 ha = 4.20 km²
Enter one peak hour (0–23) per species in same order as species names. Used for diel activity chart.
📊 Analysis Results —
Relative Abundance Index (RAI) — Core Formula
The primary metric in camera trap analysis. Standardises detection effort across sites and seasons:
RAI = (Total Independent Detections ÷ Total Trap Nights) × 100
- RAI: Relative Abundance Index — detections per 100 trap nights
- Independent Detections: Events separated by ≥ independence threshold (default 30 min)
- Trap Nights: Sum of active camera-nights (cameras × operating days)
- Detection Rate: Detections per trap night (RAI / 100)
- Photographic Rate: Total photos per trap night (may exceed detections)
- Species Density: Species richness per 100 ha study area
| Species | Detections | RAI | Detection Rate | % Relative Abundance | Activity Period |
|---|
| Metric | Value | Description |
|---|
📈 Detection Rate per Species (RAI)
🌙 Diel Activity Pattern (Peak Hours)
🔍 Plain Language Interpretation ▼
✍️ How to Write Your Results in Research
▶ Run the analysis above to auto-fill all five reporting examples with your results.
🧮 Technical Notes ▼
🎯 When to Use Camera Trap Analysis ▼
❓ Frequently Asked Questions ▼
📖 How to Use This Tool — Step-by-Step Guide ▼
📚 References ▼


