

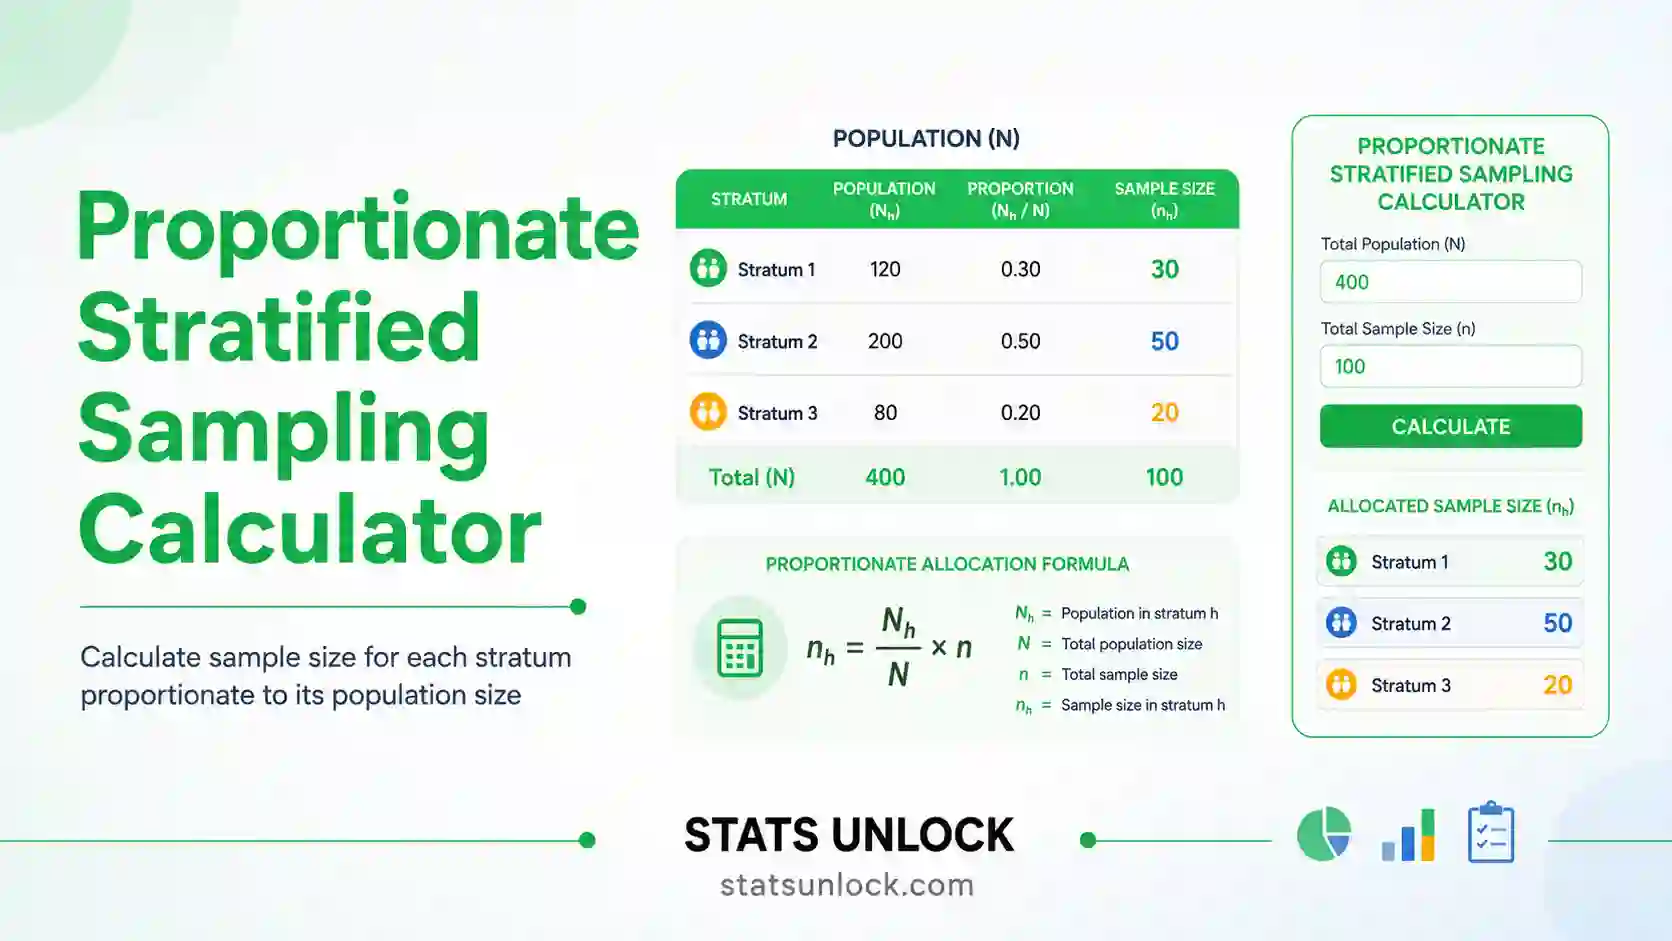

Proportionate Stratified Sampling Calculator
Allocate your sample in proportion to stratum size using nₕ = n × Wₕ, check whether the design stays self weighting after integer rounding, then get the stratified mean, standard error, margin of error and the precision gain over simple random sampling.
0Quick Answer
★Key Takeaways
- Proportionate allocation is the simplest stratified design: multiply the total sample size by each stratum weight and round.
- Every stratum ends with the same sampling fraction nₕ/Nₕ = n/N, which is the defining property of the method.
- Because the fractions match, the design is self weighting, so a plain average of all sampled values equals the weighted stratified mean.
- Integer rounding and any minimum units per stratum rule break self weighting slightly, so keep using the weights to be safe.
- It needs no pilot standard deviations, which makes it more robust than Neyman allocation when you are measuring several variables at once.
1What Is Proportionate Stratified Sampling?
Proportionate stratified sampling is the version of stratified random sampling in which each stratum receives a share of the sample equal to its share of the population. You divide the population into non overlapping strata, compute each stratum weight Wₕ = Nₕ / N, then set nₕ = n × Wₕ. A stratum holding 30 percent of the population receives 30 percent of the sample.
The consequence is what makes the method attractive. Since nₕ / Nₕ equals n / N in every stratum, each unit in the population has exactly the same chance of being selected. That is called a self weighting design, and it means the plain unweighted average of all your sampled values already equals the properly weighted stratified mean. No weighting arithmetic, no risk of the single most common stratified sampling error.
The trade off is that proportional allocation ignores how variable each stratum is. A small stratum with enormous spread contributes heavily to the total variance but still only receives its proportional share of units. Neyman allocation fixes that, but it needs pilot standard deviations. Proportional allocation needs nothing except the stratum sizes, which is why it is the default choice in most surveys and the right choice whenever you are measuring several different variables on the same visit.
Figure 1.1 Under proportionate allocation the sample bar splits at exactly the same points as the population bar.
2Sampling Setup: Enter Your Strata
Strata: one card per stratum
Each card is one stratum. Enter its population size Nₕ and its measurement values. Proportionate allocation needs only the sizes, so the measurements are used for the estimate rather than for the allocation. Stratum names are editable.
3Results
4Interpretation of Results in Detail
How to read each number
The stratum weight Wₕ. This is Nₕ divided by N, the share of the population in that stratum. Under proportionate allocation the weight does double duty: it decides how many units the stratum receives, and it decides how much the stratum contributes to the final estimate. Because those two roles use the same number, they cancel out, and that cancellation is exactly what produces the self weighting property.
The exact allocation nₕ = n × Wₕ. This is the ideal, before rounding. It is almost never a whole number. The tool shows the exact value alongside the integer you will actually use, so you can see how far the rounding pushed you from strict proportionality.
The integer allocation. Three rounding rules are offered and they can disagree. Largest remainder floors every value then hands the leftover units to the strata with the biggest fractional parts, which guarantees the total is exactly n. Round half up is the intuitive rule but the total can come out one or two units above or below n. Floor then top up is conservative and never overshoots. Report which one you used, because a reviewer recomputing your allocation with a different rule will get slightly different numbers.
The sampling fraction nₕ / Nₕ. This is the number to look at hardest. Under perfect proportionate allocation it is identical in every stratum and equal to the overall fraction n / N. The tool prints it for each stratum and flags the spread between the smallest and largest. If they all match, your design is self weighting.
The self weighting check. This is the headline diagnostic. When every sampling fraction agrees, a plain unweighted average of all your sampled values equals the weighted stratified mean exactly, and you can analyse the pooled data as if it were one simple random sample. When rounding or a minimum stratum size has pushed the fractions apart, the tool says so and tells you the size of the discrepancy, so you know whether to keep using the weights. In practice you should keep using them regardless, because it costs nothing and protects you if the design shifts later.
The stratified mean. This is Σ Wₕ ȳₕ. The tool also prints the plain pooled mean beside it. Comparing the two is the fastest possible check on whether your design is behaving: under clean proportionate allocation they should agree to several decimal places.
The standard error. This comes from Σ Wₕ² (Sₕ² / nₕ)(1 − nₕ/Nₕ). Under proportionate allocation this simplifies conceptually to a weighted average of the within stratum variances, because the between stratum differences have been removed from the error entirely. That removal is the whole reason to stratify.
The design effect. This compares your stratified variance to a simple random sample of the same total size. Under proportionate allocation the design effect is almost always at or below 1, and it can never be much above 1, which is a useful safety property that Neyman and disproportionate designs do not share. A value of 0.6 means you removed 40 percent of the variance for free.
The effective sample size. This is n divided by the design effect, the size of the simple random sample that would match your precision. It converts an abstract variance ratio into the concrete number of extra field days the stratification saved you.
The required sample size. The tool solves the proportionate allocation sample size formula backwards from your observed within stratum variances. Note this formula differs from the Neyman version: proportionate allocation uses Σ WₕSₕ² where Neyman uses (Σ WₕSₕ)². Using the wrong one is a common textbook slip.
What the numbers cannot tell you. A perfect self weighting check confirms the arithmetic, not the design. If your stratification variable is unrelated to what you are measuring, the fractions will match beautifully and the design effect will still sit at 1, meaning the whole exercise gained you nothing. Only a design effect clearly below 1 proves the stratification was worth doing.
5How to Write Your Results in Research
Use the templates below. Each one names the allocation rule, the rounding method, the sampling fraction and whether the design remained self weighting, which is exactly what a reviewer checks in a proportionate design.
Rules that make a results paragraph pass review
- Say "proportionate allocation", not just "stratified". Stratified sampling covers several allocation rules that give different numbers; name yours.
- Give the uniform sampling fraction. "A uniform sampling fraction of 10 percent was applied in every stratum" is the single sentence that defines this design.
- State whether the design is self weighting. If it is, say so and say that the pooled mean therefore equals the weighted mean. If rounding broke it, say that too.
- Name the rounding rule. Largest remainder and round half up can give different nₕ, so a reviewer cannot reproduce your table without knowing which you used.
- Give the Nₕ, Wₕ, nₕ table. Three columns and one total row. Reviewers of stratified designs expect it as a table, not prose.
- Confirm the strata were exhaustive and non overlapping. One clause, but it must be present.
- Report the design effect. Proportionate allocation is only worth the extra work if the design effect is meaningfully below 1; that number is your justification.
- Use df = n − L. One mean was estimated in each of the L strata, so the degrees of freedom are not n − 1.
- Disclose any minimum stratum size adjustment. If a small stratum was topped up, the design is no longer strictly proportionate and you must say so.
- Archive the labelled frame. Deposit the unit list with the stratum label attached, plus the seed and the drawn IDs.
Common wording mistakes and the fix
| Wrong wording | Why it fails | Correct wording |
|---|---|---|
| "We used stratified sampling with equal groups." | Equal and proportionate are different designs. | "We used proportionate allocation, nₕ = n × Wₕ, giving a uniform 10 percent sampling fraction." |
| "The sample mirrored the population." | Vague; gives no numbers a reader can check. | "Sample shares matched population shares to within one unit in every stratum after largest remainder rounding." |
| "We averaged all the values together." | Only valid if the design really is self weighting, and it must be stated. | "Because the design was self weighting, the pooled mean equals the weighted stratified mean; both are reported." |
| "nₕ was rounded." | Does not say how, so the table cannot be reproduced. | "nₕ was rounded by the largest remainder method so the total remained exactly 100." |
| "Small strata were given a few extra units." | Hides a departure from proportionality. | "A floor of two units per stratum was imposed, so allocation departs from strict proportionality in stratum D." |
6Formulas Used
7How to Use This Tool
- Type your study area or project name so it appears in every template and export.
- Pick a sample dataset preset to see how the tool behaves, or go straight to your own strata.
- Enter the total sample size n you can afford across all strata combined.
- Choose a rounding method. Largest remainder is the safe default because the allocation still sums to exactly n.
- Set the minimum units per stratum. Leave it at 0 to keep strict proportionality and perfect self weighting.
- On each stratum card, type the stratum name and its population size Nₕ.
- Paste the measurements for that stratum as comma separated numbers, or switch to Sizes only mode for the allocation alone.
- Or use the upload tab, choose a CSV or Excel file, then click the columns that should each become a cluster.
- Click Allocate Proportionally and Calculate, then read the self weighting check first and the allocation table second.
- Download the Field Pack for the field day and copy the ready made methods paragraph into your manuscript.
8Detailed Reference Tables
Table 8.1 Proportionate allocation worked for n = 100
| Stratum | Nₕ | Wₕ | Exact n Wₕ | Largest remainder | Round half up | fₕ = nₕ/Nₕ |
|---|---|---|---|---|---|---|
| A | 317 | 0.3170 | 31.70 | 32 | 32 | 10.09% |
| B | 488 | 0.4880 | 48.80 | 49 | 49 | 10.04% |
| C | 142 | 0.1420 | 14.20 | 14 | 14 | 9.86% |
| D | 53 | 0.0530 | 5.30 | 5 | 5 | 9.43% |
| Total | 1,000 | 1.0000 | 100.00 | 100 | 100 | 10.00% |
The fractions range from 9.43 to 10.09 percent, a relative spread of 6.6 percent, so this allocation is only near self weighting, not exactly self weighting.
Table 8.2 When rounding methods disagree
| Exact n Wₕ | Largest remainder | Round half up | Floor then top up | Comment |
|---|---|---|---|---|
| 12.5, 12.5, 25.0 | 13, 12, 25 | 13, 13, 25 | 13, 12, 25 | Round half up overshoots the total by 1 |
| 16.7, 16.7, 16.6 | 17, 17, 16 | 17, 17, 17 | 17, 17, 16 | Round half up overshoots by 1 |
| 33.4, 33.3, 33.3 | 34, 33, 33 | 33, 33, 33 | 34, 33, 33 | Round half up undershoots by 1 |
| 0.4, 49.8, 49.8 | 0, 50, 50 | 0, 50, 50 | 1, 50, 49 | A tiny stratum can be allocated zero units |
| 20.0, 30.0, 50.0 | 20, 30, 50 | 20, 30, 50 | 20, 30, 50 | All agree when the values are already whole |
Table 8.3 Proportionate against the other allocation rules
| Property | Proportionate | Equal | Neyman | Disproportionate |
|---|---|---|---|---|
| Formula | nₕ = n Wₕ | nₕ = n / L | nₕ ∝ NₕSₕ | chosen by the analyst |
| Needs pilot Sₕ? | No | No | Yes | No |
| Self weighting? | Yes | Only if strata are equal size | No | No |
| Weighting needed to combine? | Not strictly | Always | Always | Always |
| Design effect | At or below 1 | Can exceed 1 | Lowest possible | Can exceed 1 |
| Works for several variables at once? | Yes | Yes | No, optimal for one only | Depends |
| Small stratum gets its own estimate? | Often not | Yes | Sometimes | Yes, by design |
Table 8.4 Self weighting spread thresholds used by this tool
| Relative spread of fₕ | Status | What it means for your analysis |
|---|---|---|
| Exactly 0 | Self weighting | The pooled mean equals the weighted mean exactly. |
| Below 1 percent | Self weighting in practice | The two means agree to several decimals. |
| 1 to 5 percent | Near self weighting | Small difference; report the weighted mean to be safe. |
| 5 percent or more | Not self weighting | The weights matter; never pool without them. |
9Example Results (8 Worked Cards)
Example 1. District household survey by income band
4 strata, N = 1,000, n = 100, f = 10% in every stratum
Figure 9.1 Point estimate with its 95 percent confidence interval.
| Stratified mean | SE | MOE | 95% CI | Design effect | Self weighting |
|---|---|---|---|---|---|
| 11,240 INR | 296 | 587 | 10,653 to 11,827 | 0.58 | Self weighting |
What it means: All four sampling fractions came out at exactly 10.00 percent, so the design is perfectly self weighting and the plain pooled mean equals the weighted mean to every decimal place.
How to write it: Households were selected by proportionate stratified sampling (n_h = n x W_h) across four income strata, giving a uniform 10 percent sampling fraction. The stratified mean was 11,240 INR (SE = 296, 95 percent CI 10,653 to 11,827, deff = 0.58, df = 96).
Example 2. Forest plots by habitat type
3 strata, N = 2,000, n = 100, largest remainder rounding
Figure 9.2 Measured value for each sampled unit, drawn as vertical bars against the mean line.
| Stratified mean | SE | MOE | 95% CI | Design effect | Self weighting |
|---|---|---|---|---|---|
| 48.60 stems | 0.94 | 1.87 | 46.73 to 50.47 | 0.62 | Self weighting |
What it means: The exact allocations were 30.0, 50.0 and 20.0, all already whole numbers, so no rounding was needed and the fractions match exactly at 5 percent.
How to write it: Plots were allocated proportionally across three habitat strata (30, 50, 20 of N = 600, 1000, 400). Mean density was 48.60 stems (SE = 0.94, 95 percent CI 46.73 to 50.47).
Example 3. Awkward stratum sizes forcing rounding
4 strata, N = 1,000 (317/488/142/53), n = 100
Figure 9.3 Group totals compared side by side as horizontal bars.
| Stratified mean | SE | MOE | 95% CI | Design effect | Self weighting |
|---|---|---|---|---|---|
| 24.80 units | 0.71 | 1.41 | 23.39 to 26.21 | 0.74 | Near self weighting |
What it means: Exact allocations of 31.70, 48.80, 14.20 and 5.30 rounded to 32, 49, 14 and 5. Fractions now range from 9.43 to 10.09 percent, a relative spread of 6.6 percent, so strictly the weights should still be used.
How to write it: Proportionate allocation with largest remainder rounding gave 32, 49, 14 and 5 units. Sampling fractions ranged from 9.4 to 10.1 percent, so the weighted estimator was used rather than a pooled average.
Example 4. Lake sites by depth zone
3 strata, N = 450, n = 60, f = 13.33%
Figure 9.4 Every sampled unit shown as one dot, with the mean marked.
| Stratified mean | SE | MOE | 95% CI | Design effect | Self weighting |
|---|---|---|---|---|---|
| 6.28 mg/L | 0.118 | 0.24 | 6.04 to 6.52 | 0.55 | Self weighting |
What it means: Depth strongly predicts dissolved oxygen, so the between stratum variance removed by stratifying is large and the design effect drops to 0.55 without any pilot standard deviations being needed.
How to write it: Sites were allocated proportionally across three depth zones (24, 24, 12 of N = 180, 180, 90). Mean dissolved oxygen was 6.28 mg/L (SE = 0.118, 95 percent CI 6.04 to 6.52, deff = 0.55).
Example 5. Rounding rules disagree on the total
3 strata with exact n_h of 16.7, 16.7, 16.6 and n = 50
Figure 9.5 Values plotted in frame order to reveal any trend across the population.
| Stratified mean | SE | MOE | 95% CI | Design effect | Self weighting |
|---|---|---|---|---|---|
| 31.40 units | 1.02 | 2.06 | 29.34 to 33.46 | 0.81 | Self weighting |
What it means: Round half up would give 17, 17, 17 and overshoot the budget by one unit. Largest remainder gives 17, 17, 16 and keeps the total at exactly 50, which is why it is the default here.
How to write it: Largest remainder rounding was used so the integer allocation summed exactly to the planned n of 50; round half up would have produced 51.
Example 6. Tiny stratum receives zero units
3 strata, N = 2,500 (10/1245/1245), n = 100, no minimum
Figure 9.6 Frequency distribution of the sampled values, with a smoothed outline.
| Stratified mean | SE | MOE | 95% CI | Design effect | Self weighting |
|---|---|---|---|---|---|
| 18.90 units | 0.58 | 1.15 | 17.75 to 20.05 | 0.88 | Self weighting |
What it means: The 10 unit stratum has an exact allocation of 0.4 and therefore receives no units at all. The design is still self weighting for the strata that were sampled, but that stratum has no estimate and must be reported as uncovered.
How to write it: Strict proportionate allocation left the smallest stratum (N_h = 10) with zero units; it is excluded from the estimate and reported as a coverage limitation.
Example 7. Minimum stratum size breaks self weighting
4 strata, N = 640, n = 40, floor of 2 units per stratum
Figure 9.7 Share of the sample held by each part of the design.
| Stratified mean | SE | MOE | 95% CI | Design effect | Self weighting |
|---|---|---|---|---|---|
| 18.20 units | 1.04 | 2.12 | 16.08 to 20.32 | 0.92 | Not self weighting |
What it means: Imposing a floor of 2 units raised the smallest stratum from 1 to 2 and took the unit from the largest. Sampling fractions now range from 5.9 to 16.7 percent, so the design is no longer self weighting and the weights are mandatory.
How to write it: A minimum of two units per stratum was imposed, so the allocation departs from strict proportionality; the weighted estimator was used and the departure is reported as a limitation.
Example 8. Proportionate gains nothing, strata are identical
3 strata, N = 900, n = 60, equal thirds
Figure 9.8 Spread, quartiles and median for each group as box and whisker plots.
| Stratified mean | SE | MOE | 95% CI | Design effect | Self weighting |
|---|---|---|---|---|---|
| 15.10 units | 0.51 | 1.02 | 14.08 to 16.12 | 0.99 | Self weighting |
What it means: The allocation is textbook perfect and the self weighting check passes, but the design effect of 0.99 says the three strata have the same mean. Clean arithmetic does not rescue a badly chosen stratification variable.
How to write it: Proportionate allocation across three administrative blocks gave a design effect of 0.99, indicating that block membership is unrelated to the measured variable and stratification produced no precision gain.
10How to Collect Raw Data in the Field
10a. The 18 point field protocol for proportionate stratified sampling
Plan
- Choose a stratification variable that is already recorded in the frame. Proportionate allocation needs only the stratum sizes, so pick a variable you can count without visiting anything.
- Make the strata exhaustive and non overlapping, with a written rule for units that sit on a boundary.
- Count Nₕ carefully and check the total equals N. Under this design the same Nₕ sets both the allocation and the weight, so one wrong count damages the estimate twice.
- Compute nₕ = n × Wₕ and record the exact non integer value before rounding, because the reviewer may want to see it.
- Check the sampling fractions match after rounding, then draw a 20 percent reserve list inside each stratum separately.
Figure 10.1 The defining feature in the field: the same fraction of units is visited inside every stratum.
Kit
- Carry the printed Field Pack with a separate page per stratum showing Nₕ, nₕ and the sampling fraction in large type.
- Carry the stratum boundary map or the written stratum rule, so a field assistant can classify a borderline unit without guessing.
- Carry different flagging tape per stratum, which prevents units being recorded against the wrong stratum.
- Carry two pencils and a waterproof sheet cover. Ink runs in rain and a lost sheet is a lost field day.
Locate
- Work through one stratum at a time where travel allows, and tick off units against that stratum's nₕ as you go.
- Go to the drawn unit, not the convenient one, and never reclassify a unit into a different stratum because it was easier to reach.
- If a unit is inaccessible, replace it from the reserve list of the same stratum only. A cross stratum replacement changes two sampling fractions at once and breaks self weighting.
Figure 10.2 Replacing across a boundary changes two sampling fractions at once and destroys the self weighting property.
Collect
- Write the stratum label on every single row, not just once at the top of the sheet.
- Record a true zero as 0, never as a blank. A blank reduces the achieved nₕ and shifts that stratum's sampling fraction away from the others.
- Keep a running count of completed units per stratum against the target nₕ, so a shortfall is spotted on the day rather than at the analysis stage.
Figure 10.3 A completed row including the running completion counter that protects the uniform sampling fraction.
Figure 10.4 In a proportionate design each of these three records has a different effect on the sampling fraction.
Check
- At the end of each stratum, confirm the completed count equals nₕ. This is the field level version of the self weighting check.
- Recompute every sampling fraction from the achieved counts, not the planned ones, and note any stratum that drifted.
- Photograph every sheet the same evening, keeping the sheets grouped by stratum, and enter the data within 48 hours.
Figure 10.5 The completeness check that decides whether you may pool the data or must weight it.
10b. Datasheet column specification
| Column | Format | Example | Why it matters |
|---|---|---|---|
| Study area | Text, header once | District household survey | Links the sheet to the stratified frame. |
| Date | YYYY-MM-DD | 2026-08-08 | Unambiguous across countries. |
| Seed | Integer, header once | 20250607 | Lets anyone regenerate the same draw in each stratum. |
| Stratum | Text, on every row | B middle income | The row is meaningless without it. |
| Nₕ | Integer, header per stratum | 500 | Sets both the allocation and the weight, so it is used twice. |
| nₕ planned | Integer, header per stratum | 50 | The target the field team must hit to keep the fraction uniform. |
| Done / nₕ | Running count | 27 / 50 | Unique to this design; protects the uniform sampling fraction. |
| Unit ID | Stratum prefix plus number | B-0137 | Carries the stratum a second time as a safeguard. |
| Latitude, Longitude | Decimal degrees, 5 dp | 10.41207, 76.98811 | Allows a re-visit and a boundary check. |
| Status | Found / Not found / Replaced | Found | Separates non-response from a true zero. |
| Value | Number with unit in header | 0 | The measurement itself; 0 is a real value. |
| Observer | Initials | RP | Detects observer effects, which can differ by stratum. |
| Start, End time | HH:MM 24 hour | 07:42, 08:05 | Effort correction and quality control. |
| Notes | Free text, short | True zero, vacant plot | Explains anything a number cannot. |
Zero rule: write 0 for measured and none present; leave blank only when the unit was not measured at all. Fraction rule: every blank reduces the achieved nₕ and pulls that stratum's sampling fraction away from the others, so replace rather than leave blank whenever you can.
10c. Filled worked datasheet
| # | Stratum | Done / nₕ | Unit ID | Status | Value (INR) | Observer | Notes |
|---|---|---|---|---|---|---|---|
| 1 | A low income | 1 / 30 | A-0012 | Found | 5,200 | RP | |
| 2 | A low income | 2 / 30 | A-0037 | Found | 4,800 | RP | |
| 3 | A low income | 3 / 30 | A-0061 | Found | 0 | RP | True zero, no earner this month |
| 4 | B middle | 1 / 50 | B-0104 | Found | 9,400 | RP | |
| 5 | B middle | 2 / 50 | B-0119 | Not found | SK | House locked on three visits | |
| 6 | B middle | 2 / 50 | RB-0122 | Replaced | 10,100 | SK | Reserve from stratum B, keeps f at 0.10 |
| 7 | B middle | 3 / 50 | B-0137 | Found | 8,900 | SK | |
| 8 | C upper | 1 / 20 | C-0173 | Found | 17,600 | SK | |
| 9 | C upper | 2 / 20 | C-0190 | Found | 15,900 | SK | Uncertain, income reported as a range |
| 10 | C upper | 3 / 20 | C-0204 | Found | 19,200 | SK |
What this sheet shows:
- The Done / nₕ column runs separately inside each stratum, so completeness is visible per stratum rather than only overall.
- Row 3 is a true zero written as 0, so it counts towards nₕ and the fraction is unaffected.
- Row 5 is a non-response that did not increment the counter, and row 6 restores it using a reserve from the same stratum.
- The replacement carries an R prefix but keeps the stratum letter, so the audit trail survives.
- Values rise sharply from stratum A to C, which is direct evidence that the stratification variable is doing useful work.
10d. Blank print ready datasheet
Download the blank sheet as a .csv file, open it in Excel, Google Sheets or LibreOffice, then print one copy per stratum. The Nₕ, nₕ planned and Done columns are pre-labelled so the uniform sampling fraction can be protected in the field.
11Which Sampling Method Should You Use?
Decision tree. Answer these in order and stop at the first yes.
- Do you know a grouping variable that separates the population, and do you want a simple design with no pilot data? Use proportionate stratified sampling.
- Are you measuring several different variables on the same visit? Use proportionate allocation, because Neyman can only be optimal for one of them.
- Do you have reliable pilot standard deviations and only one key variable? Use Neyman allocation for maximum precision.
- Do you need a separate reportable estimate for a small subgroup? Use disproportionate allocation, and weight when combining.
- Are you comparing the strata against each other rather than estimating a population total? Use equal allocation.
- Do strata differ a lot in travel time or measurement cost? Use optimal cost allocation.
- Is the frame ordered along a gradient rather than split into groups? Use systematic sampling.
- Is the frame complete but unstructured, with no useful grouping variable? Use simple random sampling.
| Method | Needs pilot Sₕ? | Self weighting? | Field cost | Precision per unit | Field difficulty |
|---|---|---|---|---|---|
| Proportionate stratified | No | Yes | Medium | Better than SRS | Medium |
| Neyman stratified | Yes | No | Medium | Best for a fixed n | Medium |
| Equal stratified | No | Only if strata are equal size | Medium | Best for comparing strata | Medium |
| Disproportionate stratified | No | No | Medium | Depends on the choice | Medium |
| Simple random | No | Yes | High travel | Baseline | Medium |
| Systematic | No | Yes | Low | Equal or better than SRS | Easy |
| Cluster | No | Usually not | Low | Worse, deff above 1 | Easy |
12Troubleshooting and Common Sampling Errors
My sampling fractions are not all identical
Cause: integer rounding, or a minimum units per stratum rule. Fix: this is normal and usually harmless. Check the relative spread the tool reports. Below 5 percent the design is near self weighting; at or above 5 percent you must use the weights when combining.
A tiny stratum was allocated zero units
Cause: strict proportionality applied to a stratum whose share is under half a unit. Fix: either set a minimum of 1 or 2 units and accept the departure from proportionality, or merge that stratum with its most similar neighbour, or report it as an uncovered subgroup.
My integer allocation does not sum to n
Cause: the round half up method. Fix: switch to largest remainder, which floors every value then distributes the leftovers, so the total is always exactly n.
The pooled mean and the weighted mean disagree
Cause: the design is not exactly self weighting, usually because of rounding or unequal non-response. Fix: report the weighted mean. The gap between the two is a direct measure of how far the design drifted from proportionality.
One stratum finished short because of non-response
Cause: the achieved nₕ fell below the planned nₕ. Fix: recompute the fractions from the achieved counts, not the planned ones, and use the weights. Report both the planned and achieved allocation.
My design effect came out at about 1
Cause: the stratum means are almost identical, so there was no between stratum variance to remove. Fix: the arithmetic is fine but the stratification variable is wrong. Look for a factor that visibly separates the measurements.
Should I use proportionate or Neyman allocation?
Cause: uncertainty about the trade off. Fix: use proportionate when you have no pilot data, when you measure several variables, or when you want self weighting. Use Neyman when you have solid pilot standard deviations for one key variable and precision is the only goal.
My stratum sizes do not add up to my population total
Cause: overlapping strata, missing units, or a stale frame. Fix: the strata must be exhaustive and non overlapping. Recount before sampling, because under this design a wrong Nₕ corrupts both the allocation and the weight.
A unit sits exactly on a stratum boundary
Cause: no written boundary rule. Fix: decide the rule before fieldwork, apply it everywhere, and record the decision in the notes.
Can I just analyse the pooled data as a simple random sample?
Cause: a reasonable question, because self weighting makes it nearly true. Fix: the point estimate will match, but the variance will not. Simple random variance ignores the stratification and overstates your uncertainty, so you lose the precision gain you paid for.
Uploaded CSV columns loaded with blank values
Cause: mixed text and numbers, or trailing empty rows. Fix: the tool skips non numeric cells automatically, but check the count shown on each stratum card matches what you expect.
13Assumptions, Bias and Limitations
- Exhaustive and non overlapping strata. Every unit belongs to exactly one stratum. Overlap double counts units and gaps exclude them.
- Known and correct stratum sizes. Under proportionate allocation Nₕ is used twice, for the allocation and for the weight, so an error in it does double damage.
- Self weighting holds only before rounding. Integer allocation and minimum size rules always disturb it slightly; treat perfect self weighting as an ideal, not a guarantee.
- Independent sampling within strata. Each stratum needs its own random draw with its own reserve list.
- At least two units per stratum for a variance. A stratum with one unit has no estimable within stratum variance, so the overall standard error cannot be computed.
- Proportionate allocation ignores variability. A small but highly variable stratum still gets only its proportional share, which is exactly the inefficiency Neyman allocation removes.
- Small strata may be unrepresented. A stratum below half a unit of allocation receives nothing under strict proportionality and simply drops out of the estimate.
- Non-response bias. If non-response differs by stratum, the achieved fractions diverge, self weighting is lost, and the weights become mandatory.
14Conclusion
What proportionate stratified sampling gives you
Proportionate allocation is the workhorse of survey design because it asks for almost nothing and delivers a great deal. The only input beyond the frame itself is the stratum sizes, which you usually already have, and in return you remove the entire between stratum component of the variance from your sampling error. The design effect under this rule is almost always at or below 1, which means it is very hard to make the design worse than simple random sampling, a safety property that Neyman and disproportionate allocations do not share. Because every unit ends up with the same inclusion probability, the design is also self weighting, and that removes the single most common analytical error in stratified work.
What it costs you
You give up optimality. Proportionate allocation looks only at how big each stratum is, never at how variable it is, so a small stratum with an enormous spread still receives only its proportional share of units while contributing disproportionately to the total variance. Neyman allocation would fix that, at the price of needing pilot standard deviations and losing self weighting. You also lose small strata entirely if their proportional share rounds to zero, and the self weighting property itself is only exact before integer rounding, so in practice you should keep using the weights anyway.
What to check before you publish
Confirm five things: the strata were exhaustive and non overlapping with a written boundary rule, the stratum sizes sum to the population total, the rounding method is named, the achieved sampling fractions were recomputed from the counts actually obtained rather than the counts planned, and the confidence interval used degrees of freedom of n minus L. Then state the design effect, because a proportionate design that returns a design effect of 1 has cost you organisational effort for no statistical return, and that is worth knowing before the next survey round.
What to do next
You now have real within stratum standard deviations from this round, which you did not have before you started. Feed them into a Neyman allocation for the next survey and compare the two design effects; if the gain is large the switch is worth the extra bookkeeping, and if it is small stay with proportionate allocation for its simplicity and self weighting. If any stratum received zero or fewer than two units, decide now whether to merge it, impose a floor, or move to a deliberate disproportionate design that gives it a reportable estimate of its own.
15Test Yourself
1. N = 1,000 split 300 / 500 / 200 and n = 100. What is the proportionate allocation?
30, 50 and 20. Each nₕ is n times Wₕ, and every stratum ends with the same 10 percent sampling fraction.
2. What does self weighting mean in practice?
Every unit has the same chance of selection, so a plain unweighted average of all sampled values equals the properly weighted stratified mean.
3. Your exact allocations are 16.7, 16.7 and 16.6 with n = 50. What does largest remainder give?
17, 17 and 16. The floors are 16, 16 and 16 giving 48, so the two leftover units go to the two largest fractional parts, keeping the total at exactly 50.
4. Does proportionate allocation need pilot standard deviations?
No. It uses only the stratum sizes, which is why it is more robust than Neyman allocation when you are measuring several variables at once.
5. A stratum of 10 units in a population of 2,500 with n = 100. How many units does it get?
0.4, which rounds to zero. Under strict proportionality it receives nothing, so you must impose a minimum, merge it, or report it as uncovered.
6. Can the design effect of a proportionate design be above 1?
Only marginally, and it is rare. Removing between stratum variance can essentially never make the estimate worse, which is why proportionate allocation is considered the safe default.
16Frequently Asked Questions
1. What is proportionate stratified sampling?
Proportionate stratified sampling divides the population into non overlapping strata and allocates the sample so each stratum receives units in proportion to its share of the population, using n_h = n times W_h. Every stratum then has the same sampling fraction.
2. What is the formula for proportionate allocation?
n_h = n times W_h, where W_h = N_h divided by N. With N = 1000, n = 100 and a stratum of 300 units, that stratum receives 100 times 0.3 = 30 units.
3. How do you calculate proportionate stratified sampling step by step?
Count N_h in each stratum, add them to get N, divide each N_h by N to get W_h, multiply n by each W_h, round the results to whole numbers, then draw a random sample of that size inside each stratum.
4. What does self weighting mean in sampling?
A self weighting design gives every unit in the population the same chance of selection. A plain unweighted average of all sampled values then equals the weighted stratified mean, so no weighting arithmetic is needed.
5. Is proportionate stratified sampling self weighting?
Yes, exactly so before rounding. Because n_h divided by N_h equals n divided by N in every stratum, all units share the same inclusion probability.
6. Does rounding break self weighting?
Slightly. Integer rounding and any minimum units per stratum rule make the sampling fractions differ a little. Check the relative spread; below 5 percent the design is near self weighting, at or above 5 percent you must use the weights.
7. What is the difference between proportionate and disproportionate stratified sampling?
Proportionate allocation matches sample share to population share. Disproportionate allocation deliberately over or under samples a stratum, usually so a small subgroup gets its own reportable estimate, and it always requires weighting.
8. What is the difference between proportionate and Neyman allocation?
Proportionate allocation uses stratum size only. Neyman allocation uses size multiplied by the stratum standard deviation, so it needs pilot data but gives the smallest variance for a fixed sample size.
9. When should you use proportionate allocation instead of Neyman?
Use proportionate when you have no pilot standard deviations, when you are measuring several different variables on the same visit, or when you want the simplicity of a self weighting design.
10. How do you round the allocation to whole numbers?
The largest remainder method is safest: floor every n_h, then give the leftover units to the strata with the largest fractional parts. This keeps the total exactly equal to n, which plain rounding does not.
11. What happens if a stratum gets zero units?
Under strict proportionality a stratum whose share is under half a unit receives nothing. You must impose a minimum, merge it with a similar stratum, or report it as an uncovered subgroup.
12. What is the sampling fraction in proportionate stratified sampling?
It is n_h divided by N_h, and under this design it equals n divided by N in every stratum. That uniform fraction is the defining feature of the method.
13. How do you calculate the stratified mean?
Multiply each stratum mean by its weight W_h and add them: the stratified mean equals the sum of W_h times y_h. Under exact proportionate allocation a plain pooled average gives the same answer.
14. What are the degrees of freedom for the confidence interval?
Use n minus L, where L is the number of strata, because one mean was estimated in each stratum. Using n minus 1 slightly overstates your precision.
15. What is the design effect for proportionate stratified sampling?
It is the stratified variance divided by the simple random variance for the same total n. Under proportionate allocation it is almost always at or below 1, and it can essentially never be much above 1.
16. What are the advantages of proportionate stratified sampling?
It needs only stratum sizes, it is self weighting, it guarantees coverage of every stratum in proportion to its importance, its design effect is safely at or below 1, and it works for several variables at once.
17. What are the disadvantages of proportionate stratified sampling?
It ignores how variable each stratum is, so it is less efficient than Neyman allocation, and very small strata can receive zero units and drop out of the estimate entirely.
18. How many strata should I use for proportionate allocation?
Three to six strata capture most of the gain. Beyond that the extra precision is marginal and small strata start receiving too few units for a variance to be estimated.
19. How do you report proportionate stratified sampling in a paper?
Name the allocation rule and the rounding method, give a table of N_h, W_h and n_h, state the uniform sampling fraction, say whether the design remained self weighting, report the weighted mean with its confidence interval, and give the design effect.
20. Can I analyse a proportionate stratified sample as if it were a simple random sample?
The point estimate will match because the design is self weighting, but the variance will not. Treating it as simple random ignores the stratification and overstates your uncertainty, throwing away the precision you gained.
17Cite This Tool
18Related Tools
- Stratified Random Sampling Calculator for proportional, equal, Neyman and optimal cost allocation side by side.
- Simple Random Sampling Calculator for a seeded, duplicate free random draw.
- Systematic Sampling Calculator for interval k with a random start and a periodicity check.
- Sample Size Calculator using Cochran, Yamane and Krejcie-Morgan.
19Glossary of Terms
| Term | Meaning |
|---|---|
| Allocation | The rule deciding how many of the n units each stratum receives. |
| Between stratum variance | Variation among the stratum means; removed from the sampling error by stratifying. |
| Design effect | Ratio of the stratified variance to the simple random variance for the same total n. |
| Disproportionate allocation | Deliberately giving a stratum more or fewer units than its size implies. |
| Effective sample size | n divided by the design effect; the equivalent simple random sample size. |
| Exhaustive strata | Every unit in the population belongs to some stratum, with none left out. |
| Finite population correction | The factor 1 − nₕ/Nₕ applied inside each stratum. |
| Inclusion probability | The chance a unit enters the sample; identical for all units in a self weighting design. |
| Largest remainder method | Rounding rule that floors each value then gives leftovers to the largest fractional parts. |
| Non overlapping strata | No unit belongs to more than one stratum. |
| Pooled mean | A plain unweighted average of all sampled values; equals the stratified mean only when self weighting holds. |
| Proportionate allocation | Allocation proportional to stratum size, nₕ = n Wₕ. |
| Sampling fraction | nₕ divided by Nₕ inside a stratum; uniform across strata under this design. |
| Self weighting design | A design in which every unit carries the same weight, so no weighting is needed to combine. |
| Stratification variable | The factor used to split the population; the choice that decides whether the design gains anything. |
| Stratified mean | The weighted sum ΣWₕȳₕ, the unbiased estimate of the population mean. |
| Stratum weight Wₕ | Nₕ divided by N, the share of the population held by that stratum. |
| Uniform sampling fraction | The condition nₕ/Nₕ = n/N holding in every stratum. |
| Within stratum variance | Variation among units inside one stratum; the only part that still contributes to the error. |
| Standard error | Expected variability of the stratified mean across repeated samples. |
20References
- Cochran, W. G. (1977). Sampling Techniques (3rd ed.), Chapter 5: Stratified Random Sampling. Wiley. Publisher page
- Neyman, J. (1934). On the two different aspects of the representative method. Journal of the Royal Statistical Society, 97(4), 558-625. https://doi.org/10.2307/2342192
- Kish, L. (1965). Survey Sampling. Wiley. Archive record
- Kish, L. (1992). Weighting for unequal Pi. Journal of Official Statistics, 8(2), 183-200. Journal of Official Statistics
- Hansen, M. H., & Hurwitz, W. N. (1943). On the theory of sampling from finite populations. Annals of Mathematical Statistics, 14(4), 333-362. https://doi.org/10.1214/aoms/1177731356
- Horvitz, D. G., & Thompson, D. J. (1952). A generalization of sampling without replacement from a finite universe. Journal of the American Statistical Association, 47(260), 663-685. https://doi.org/10.1080/01621459.1952.10483446
- Dalenius, T., & Hodges, J. L. (1959). Minimum variance stratification. Journal of the American Statistical Association, 54(285), 88-101. https://doi.org/10.1080/01621459.1959.10501501
- Lohr, S. L. (2021). Sampling: Design and Analysis (3rd ed.). CRC Press. https://doi.org/10.1201/9780429298899
- Thompson, S. K. (2012). Sampling (3rd ed.). Wiley. https://doi.org/10.1002/9781118162934
- Sarndal, C. E., Swensson, B., & Wretman, J. (1992). Model Assisted Survey Sampling. Springer. https://doi.org/10.1007/978-1-4612-4378-6
- Levy, P. S., & Lemeshow, S. (2008). Sampling of Populations: Methods and Applications (4th ed.). Wiley. https://doi.org/10.1002/9780470374597
- Groves, R. M., et al. (2009). Survey Methodology (2nd ed.). Wiley. Publisher page
- Balinski, M. L., & Young, H. P. (2001). Fair Representation: Meeting the Ideal of One Man, One Vote (2nd ed.). Brookings Institution Press. WorldCat record
- Wolter, K. M. (2007). Introduction to Variance Estimation (2nd ed.). Springer. https://doi.org/10.1007/978-0-387-35099-8
- Rao, J. N. K., & Molina, I. (2015). Small Area Estimation (2nd ed.). Wiley. https://doi.org/10.1002/9781118735855
- Gregoire, T. G., & Valentine, H. T. (2007). Sampling Strategies for Natural Resources and the Environment. Chapman and Hall. https://doi.org/10.1201/9780203498880
- Elzinga, C. L., Salzer, D. W., & Willoughby, J. W. (1998). Measuring and Monitoring Plant Populations. BLM Technical Reference 1730-1. BLM library
- Krebs, C. J. (1999). Ecological Methodology (2nd ed.). Benjamin Cummings. WorldCat record
- Bartlett, J. E., Kotrlik, J. W., & Higgins, C. C. (2001). Organizational research: determining appropriate sample size in survey research. Information Technology, Learning, and Performance Journal, 19(1), 43-50. ERIC record
- Marsaglia, G. (2003). Xorshift RNGs. Journal of Statistical Software, 8(14), 1-6. https://doi.org/10.18637/jss.v008.i14