

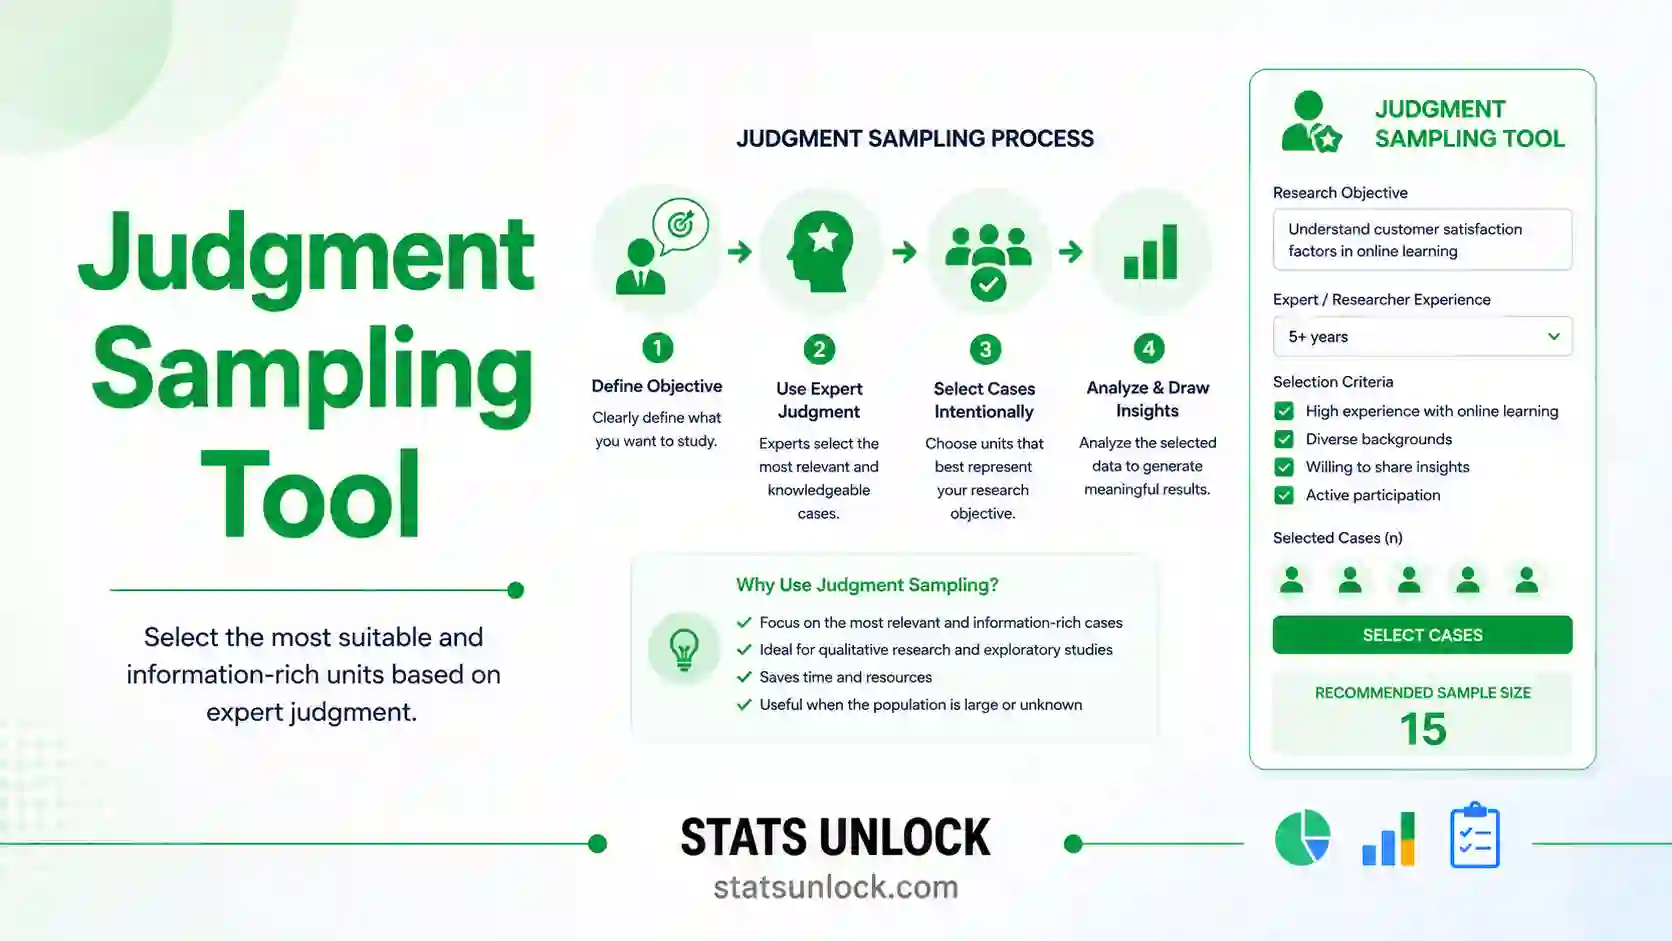

Judgment Sampling Calculator
In judgment sampling the researcher is the instrument, so the sample is only as good as the judgement behind it. This tool tests that judgement directly: it scores your exposure to eight cognitive biases known to distort expert selection, then measures whether a second or third judge would have chosen the same cases, using percent agreement, Cohen kappa, Fleiss kappa, PABAK and Jaccard overlap.
0Quick Answer
★Key Takeaways
- Judgment sampling is another name for purposive or judgmental sampling, but the practical question it raises is different: how reliable is the judge?
- A judgement nobody else would reproduce is not a sampling strategy, it is a preference. Inter-rater agreement is how you tell the two apart.
- Cohen kappa corrects agreement for chance; use Fleiss kappa for three or more judges.
- When selection is rare, kappa collapses even at high agreement. Report PABAK alongside it or you will misread your own data.
- Eight cognitive biases distort expert selection predictably. Naming which ones apply is more useful than claiming none do.
1What Is Judgment Sampling?
Judgment sampling selects units because an experienced person believes those units are the right ones to examine. An auditor picks the ledger entries that look irregular. An inspector picks the machines most likely to be failing. A supervisor picks the three sites that best represent the region. In each case a human expert, not a random mechanism, decides who is in the sample.
That makes the researcher the measuring instrument, and instruments have to be calibrated. In quantitative sampling you validate the procedure; in judgment sampling there is no procedure to validate, only a person. So the two questions that matter are whether the judgement is reliable, meaning another competent expert would reach a similar selection, and whether it is systematically distorted, meaning known cognitive biases pushed it in a predictable direction. Neither question is answered by the sample size.
Both are answerable. Reliability is measured by having two or more judges select independently from the same candidate pool and computing chance corrected agreement. Bias exposure is assessed by working through the specific heuristics that are known to distort expert selection: anchoring on the first cases seen, availability of memorable cases, halo effects from reputation, confirmation of an existing hypothesis, and simple accessibility. This tool does both.
Figure 1.1 High percent agreement can hide poor reliability, because most of it comes from agreeing on exclusions.
2Setup: The Pool, the Judges and the Bias Check
Cognitive bias exposure scorecard
Eight heuristics known to distort expert selection. Each answer scores 0 for low exposure, 1 for moderate and 2 for high. A higher total means the judgement was more likely to be pushed in a predictable direction.
Judges: one card per judge
Enter each judge and the case IDs they selected, comma separated. IDs can be anything consistent: numbers, file references, plot codes. The tool compares selections pairwise across the pool. Judge names are editable.
3Results
4Interpretation of Results in Detail
How to read each number
Percent agreement. The share of the candidate pool on which two judges made the same decision, counting both joint selections and joint rejections. It is intuitive and it is almost always misleadingly high, because when you select 8 cases from 200 the two judges agree on 192 exclusions before they consider a single inclusion. Never report percent agreement on its own for a selective task.
Expected agreement. How much of that agreement two judges would have reached by chance alone, given how often each of them selects. This is the quantity percent agreement ignores and kappa subtracts. When both judges select rarely, expected agreement is very high, which is precisely why raw agreement looks so good.
Cohen kappa. Agreement above chance, scaled so that 0 means no better than chance and 1 means perfect. The Landis and Koch bands are conventional: below 0 poor, 0 to 0.20 slight, 0.21 to 0.40 fair, 0.41 to 0.60 moderate, 0.61 to 0.80 substantial, above 0.80 almost perfect. For a selection task, moderate is a reasonable target and substantial is strong. A kappa near zero with high percent agreement means the two judges agreed on almost nothing that mattered.
The kappa paradox and PABAK. Kappa has a well documented failure mode: when the thing being judged is rare, kappa can be low or even negative while agreement is genuinely high. This is not a quirk to be explained away, it is a reason to report a second statistic. PABAK, the prevalence adjusted bias adjusted kappa, equals 2 times percent agreement minus 1, and it removes the dependence on how often selection occurs. When kappa and PABAK diverge sharply, the divergence itself is your finding: it says agreement is real but selection is rare, and you should report both figures with that explanation rather than quoting whichever number flatters you.
Fleiss kappa. When three or more judges each rate every case, Fleiss kappa gives one overall chance corrected agreement figure across the whole panel rather than a set of pairwise numbers. It answers a subtly different question: not whether two specific people agree, but whether the panel as a whole is applying a shared standard. Report Fleiss for the panel and the pairwise table underneath it, because a good overall figure can hide one judge who disagrees with everyone.
Jaccard overlap. The share of cases that either judge selected on which both agreed. Unlike percent agreement it ignores the exclusions entirely, so it answers the question a practitioner actually asks: of everything anyone flagged, how much did we both flag? It is often the most honest single number in this table, and it is always lower than percent agreement.
The selection rate per judge. How many of the pool each judge picked. Very different rates between judges are informative in themselves: one person applying a much looser threshold is not the same problem as two people disagreeing about which cases matter, and kappa alone cannot distinguish them. Compare the rates before you interpret the kappa.
Times each case was selected. The case by case map shows which units every judge flagged, which only one flagged, and which none did. Unanimous cases are your defensible core. Cases picked by exactly one judge are where the judgement was doing the work, and those are the ones a reviewer will ask about, so have a reason ready for each.
The bias exposure index. Eight heuristics, scored 0 to 2, rescaled to 0 to 100. This is not a statistic and it corrects nothing. It is a structured way of writing down what you already suspect about your own selection process, so that the limitations section names specific mechanisms instead of gesturing at subjectivity. Below 30 means the process had reasonable safeguards; above 60 means the selection was probably driven as much by the heuristics as by the criteria.
Independence of judges. This modifies everything else. If the judges discussed the cases first, or one saw the other choices, then high agreement measures conformity rather than reliability. The tool flags this because a kappa of 0.9 from two people in the same room is worth less than a kappa of 0.5 from two people working blind.
What none of this can tell you. Two judges can agree perfectly and both be wrong in the same direction. Agreement measures reliability, not validity. If both experts share the same training, the same institutional assumptions and the same blind spot, your kappa will be excellent and your sample will still miss what matters. High agreement plus a high bias score is the combination to worry about most, because it looks reassuring and is not.
5How to Write Your Results in Research
Use the templates below. Each one names the judge, the basis, the agreement statistics and the bias exposure, which is what reviewers and audit reviewers look for in a judgmental selection.
Rules that make a judgement defensible in writing
- Say who judged and what qualified them. A judgment sample rests on the judge, so anonymising the expertise removes the only warrant the design has.
- State the judgement basis as criteria, not as instinct. "Entries irregular on amount, timing or vendor" is defensible; "entries that looked wrong" is not.
- Report the candidate pool size. Selecting 8 of 200 and 8 of 12 are entirely different acts, and without N the reader cannot tell which you did.
- Give the selection rate. It sets the context for every agreement figure that follows.
- Report kappa and PABAK together when selection is rare, and explain the divergence rather than choosing the flattering number.
- Confirm the judges were independent, or say plainly that they were not. Agreement between people who conferred is conformity.
- Name the biases you were exposed to. Specific mechanisms read as competence; a blanket claim of objectivity reads as naivety.
- List the cases only one judge selected and give the reason each was kept or dropped. That list is where the judgement is visible.
- Do not report a margin of error. There is no sampling distribution behind a judgement.
- Distinguish reliability from validity explicitly. Say that agreement shows consistency, not correctness.
Common wording mistakes and the fix
| Wrong wording | Why it fails | Correct wording |
|---|---|---|
| "A judgment sample of 20 items was selected." | No judge, no basis, no pool size. | "Two auditors independently selected 20 of 200 ledger entries against three stated irregularity criteria." |
| "The two reviewers agreed on 94 percent of cases." | Almost all of that is agreement on exclusions. | "Raw agreement was 94 percent, but Cohen kappa was 0.41 and Jaccard overlap 0.34, indicating only moderate reliability." |
| "Kappa was low, so we report percent agreement instead." | Choosing the flattering statistic. | "Kappa was 0.28 against 94 percent agreement; because selection was rare (4 percent) we also report PABAK = 0.88 and interpret both." |
| "The expert selection was objective." | Unfalsifiable and undermines credibility. | "Selection was expert dependent; exposure to availability and accessibility bias is reported as a limitation." |
| "The reviewers discussed and agreed the final sample." | Describes consensus, not measured reliability. | "Reviewers selected independently, then reconciled; agreement is reported from the independent stage." |
6Formulas Used
7How to Use This Tool
- Type the engagement name and, in one line, the basis on which cases were judged.
- Enter the candidate pool size N, meaning every unit the judges could have chosen from.
- Record the expertise level of the judges and whether they worked independently, because both modify how the agreement figures should be read.
- Work through the eight cognitive bias questions honestly; scoring yourself low here only misleads you.
- Add one card per judge and paste the case IDs that judge selected, comma separated.
- Use consistent IDs across judges. The tool matches on the ID text, ignoring case and spacing.
- With two judges you get Cohen kappa and PABAK; with three or more you also get Fleiss kappa for the whole panel.
- Or switch to the upload tab and click the columns that should each become a cluster, one judge per column.
- Click Score Bias and Measure Agreement, then read the kappa card and the singleton cases first.
- Copy the methods paragraph into your report and download the judgement report for your file or working papers.
8Detailed Reference Tables
Table 8.1 The eight cognitive biases in expert selection
| Heuristic | How it distorts selection | Low exposure looks like |
|---|---|---|
| Anchoring | The first few cases examined set the template for everything after | Criteria written before any case was seen |
| Availability | Memorable or recent cases are over selected | Selection driven by records, not recall |
| Confirmation | Cases that support an existing hypothesis are preferred | Disconfirming cases deliberately sought |
| Halo and reputation | Known names or well regarded units are judged differently | Identifying details masked during selection |
| Accessibility | Easy to reach cases are chosen over relevant ones | Selection made before access was considered |
| Representativeness | Cases that look typical are assumed to be typical | Typicality checked against data, not intuition |
| Salience of extremes | Dramatic cases crowd out ordinary ones | Explicit quota for unremarkable cases |
| Stakeholder pressure | A manager or gatekeeper steers the selection | Selection made and recorded before consultation |
Table 8.2 Interpreting kappa, the Landis and Koch bands
| Kappa | Interpretation | Verdict for a selection task |
|---|---|---|
| Below 0.00 | Poor, worse than chance | Judges are picking different things |
| 0.00 to 0.20 | Slight | Not a reproducible judgement |
| 0.21 to 0.40 | Fair | Weak; tighten the criteria |
| 0.41 to 0.60 | Moderate | Acceptable, report openly |
| 0.61 to 0.80 | Substantial | Strong for expert selection |
| 0.81 to 1.00 | Almost perfect | Check the judges were truly independent |
Table 8.3 Why kappa can look wrong: the prevalence paradox
| Scenario | a / b / c / d | Percent agreement | Cohen kappa | PABAK | What to report |
|---|---|---|---|---|---|
| Balanced selection | 40 / 10 / 10 / 40 | 80.0% | 0.600 | 0.600 | Kappa alone is fine |
| Rare selection, high agreement | 4 / 2 / 2 / 92 | 96.0% | 0.645 | 0.920 | Both, with the gap explained |
| Very rare selection | 2 / 3 / 3 / 92 | 94.0% | 0.368 | 0.880 | Both; kappa understates |
| One judge much stricter | 5 / 20 / 1 / 74 | 79.0% | 0.250 | 0.580 | Both, plus the bias index |
| Near universal selection | 92 / 2 / 2 / 4 | 96.0% | 0.645 | 0.920 | Both, with the gap explained |
Table 8.4 Judgment sampling against the alternatives
| Method | Who selects | Reliability testable? | Margin of error? | Best use |
|---|---|---|---|---|
| Judgment sampling | An expert | Yes, with a second judge | No | Targeting known risk or interest |
| Purposive sampling | The researcher, by strategy | Rarely tested | No | Qualitative depth and variation |
| Haphazard or convenience | Nobody, effectively | No | No | Avoid where possible |
| Quota sampling | Fieldworker within quotas | Partly | No | Controlling composition cheaply |
| Monetary unit sampling | An algorithm, weighted by value | Not needed | Yes | Audit of monetary populations |
| Simple random | Chance | Not needed | Yes | Unbiased population estimates |
| Stratified random | Chance within strata | Not needed | Yes | Precision with known subgroups |
9Example Results (8 Worked Cards)
Example 1. Two auditors, balanced selection from 100 files
N = 100, a=40 b=10 c=10 d=40
Figure 9.1 Agreement statistics with their spread from chance level to perfect.
| Percent agreement | Cohen kappa | PABAK | Jaccard | Verdict |
|---|---|---|---|---|
| 80.0% | 0.600 | 0.600 | 0.67 | Substantial |
What it means: With selection near 50 percent, kappa and PABAK coincide at 0.600 and either can be reported alone. This is the only situation in which raw agreement, kappa and PABAK tell the same story.
How to write it: Two auditors independently selected from 100 files against three stated criteria. Raw agreement was 80.0 percent, Cohen kappa 0.600 (substantial), Jaccard overlap 0.67.
Example 2. Rare selection: the kappa paradox in action
N = 100, a=4 b=2 c=2 d=92
Figure 9.2 Times each case was selected, drawn as vertical bars against the panel average.
| Percent agreement | Cohen kappa | PABAK | Jaccard | Verdict |
|---|---|---|---|---|
| 96.0% | 0.645 | 0.920 | 0.50 | Substantial |
What it means: Agreement of 96 percent looks excellent but 92 of those cases are joint exclusions. Kappa of 0.645 is the honest figure; PABAK of 0.920 shows how much of the gap is caused by rare selection rather than poor judgement.
How to write it: Raw agreement was 96.0 percent but, because only 6 percent of the pool was selected, we report Cohen kappa 0.645 alongside PABAK 0.920 and Jaccard overlap 0.50.
Example 3. Very rare selection depresses kappa to fair
N = 100, a=2 b=3 c=3 d=92
Figure 9.3 Selection counts per judge compared side by side as horizontal bars.
| Percent agreement | Cohen kappa | PABAK | Jaccard | Verdict |
|---|---|---|---|---|
| 94.0% | 0.368 | 0.880 | 0.25 | Fair |
What it means: Only two cases were picked by both judges out of eight either flagged, so Jaccard is 0.25. Kappa of 0.368 understates agreement because of the prevalence index, but Jaccard confirms the reliability genuinely is weak here.
How to write it: Cohen kappa was 0.368 against 94.0 percent raw agreement; the prevalence index of 0.90 explains the divergence, and Jaccard overlap of 0.25 confirms limited reliability.
Example 4. One judge far stricter than the other
N = 100, a=5 b=20 c=1 d=74
Figure 9.4 Every case in the pool shown as one dot, positioned by how many judges picked it.
| Percent agreement | Cohen kappa | PABAK | Jaccard | Verdict |
|---|---|---|---|---|
| 79.0% | 0.250 | 0.580 | 0.19 | Fair |
What it means: Judge 1 selected 25 cases and Judge 2 only 6. The bias index of 0.19 flags this directly: the problem is not that the judges disagree about which cases matter, it is that they are applying different thresholds.
How to write it: Selection rates differed markedly (25 versus 6 percent), giving a bias index of 0.19; kappa of 0.250 reflects threshold disagreement rather than disagreement about individual cases.
Example 5. Four judge panel, Fleiss kappa
N = 60, m = 4 judges, 17 cases flagged
Figure 9.5 Agreement plotted across judge pairs to reveal an outlying judge.
| Percent agreement | Cohen kappa | PABAK | Jaccard | Verdict |
|---|---|---|---|---|
| 93.3% | 0.685 | 0.867 | 0.45 | Substantial |
What it means: Fleiss kappa of 0.685 across the whole panel is substantial, and the six pairwise values run from 0.555 to 0.777, so no single judge sits far from the rest. Always check that spread, because a good panel figure can hide one outlying judge.
How to write it: Four assessors rated all 60 candidates; Fleiss kappa was 0.685. Pairwise Cohen kappa ranged from 0.555 to 0.777, indicating a consistently applied shared standard.
Example 6. Judges conferred: agreement measures conformity
N = 80, judged together, a=12 b=1 c=1 d=66
Figure 9.6 Distribution of cases by the number of judges who selected them.
| Percent agreement | Cohen kappa | PABAK | Jaccard | Verdict |
|---|---|---|---|---|
| 97.5% | 0.908 | 0.950 | 0.86 | Almost perfect |
What it means: A kappa of 0.908 would be excellent from independent judges. These two discussed the cases first, so the figure measures how readily one deferred to the other. The tool flags this and the number should not be reported as reliability.
How to write it: Because assessors reviewed the cases jointly, the observed kappa of 0.908 reflects consensus rather than independent reliability, and no inter-rater reliability claim is made.
Example 7. Negative kappa: judges picking different things
N = 50, a=1 b=8 c=9 d=32
Figure 9.7 Share of the flagged pool that was unanimous, split or singleton.
| Percent agreement | Cohen kappa | PABAK | Jaccard | Verdict |
|---|---|---|---|---|
| 66.0% | -0.104 | 0.320 | 0.06 | Poor |
What it means: A negative kappa means the two judges agreed less than chance would predict. Of the 18 cases either flagged, they concurred on one. The criteria are not functioning as criteria and the selection cannot be defended as a shared standard.
How to write it: Cohen kappa was negative (-0.104) with Jaccard overlap of 0.06, indicating the two assessors were not applying a shared standard; the criteria were rewritten and selection repeated.
Example 8. Single judge, bias check only
N = 200, one expert, 15 selected
Figure 9.8 Spread of selection rates across the judge panel.
| Percent agreement | Cohen kappa | PABAK | Jaccard | Verdict |
|---|---|---|---|---|
| n/a | n/a | n/a | n/a | Not testable |
What it means: With one judge there is no agreement to measure, so the only available evidence is the bias scorecard, which came out at 56 out of 100. That is the common situation and the weakest one; half a day of a colleague re-selecting would change what this study can claim.
How to write it: Selection was made by a single expert, so inter-rater reliability could not be assessed. Bias exposure was scored at 56 of 100, with availability and accessibility bias the dominant concerns.
10How to Collect Raw Data in the Field
10a. The 18 point protocol for a defensible judgement
Plan
- Write the selection criteria before you look at a single case. This is the only defence against anchoring, and it costs ten minutes.
- Define the candidate pool explicitly and count it. Without N there is no denominator, no selection rate and no agreement statistic.
- Recruit a second judge before you start, not afterwards. A retrospective second opinion on cases already chosen measures nothing.
- Decide how disagreements will be resolved in advance: unanimous only, either judge, or reconciliation. Deciding afterwards invites the choice that flatters the result.
- Mask identifying details where you can. Removing names, units and known reputations is the cheapest available defence against halo bias.
Figure 10.1 The two judges must not see each other's selections until both are complete.
Kit
- Give each judge the identical pool list in the same order, or in a deliberately randomised order if order effects are a concern.
- Give each judge the written criteria and nothing else. Verbal briefing drifts between judges.
- Use a simple in or out recording sheet with a reason column, so the basis of each decision is captured while it is fresh.
- Keep the two sheets physically separate until both are complete.
Judge
- Have each judge decide on every case in the pool, not just mark the ones they like. Kappa needs a decision on all N.
- Record a one line reason for every selection. These reasons are what turn a judgement into a criterion applied.
- Do not let either judge revise after seeing the other sheet. Revisions belong in a separate reconciliation stage, recorded separately.
Figure 10.2 A decision on every case, with a reason, is what makes the agreement statistic computable at all.
Compare
- Compute agreement before reconciling. Once the judges discuss, the independent figure is gone and cannot be recovered.
- List the singleton cases, those exactly one judge picked, and record the reason each was ultimately kept or dropped.
- Compare the two selection rates before interpreting kappa, because a threshold difference and a case level disagreement look identical in kappa but need different fixes.
Figure 10.3 Singleton cases are where the judgement is visible, so each needs a recorded reason.
Figure 10.4 Three things that are easily confused; only the first is measured on this page.
Check
- If kappa comes out below 0.40, rewrite the criteria rather than the sample. Low agreement means the criteria are not doing the work; a bigger sample will not help.
- If kappa comes out above 0.85, verify the judges really were independent. Very high agreement on a subjective task usually means contamination.
- File both original sheets, the agreement calculation and the reconciliation record. In judgment sampling the audit trail of who decided what, and when, is the whole evidence base.
Figure 10.5 The kappa value points to a specific next action, not just a label.
10b. Recording sheet column specification
| Column | Format | Example | Why it matters |
|---|---|---|---|
| Engagement | Text, header once | Q3 expense ledger review | Links the sheet to the judgement basis. |
| Judgement basis | Text, header once | Irregular on amount, timing or vendor | The criteria as written before any case was seen. |
| Judge | Name or initials, header once | Judge A, RP | The judge is the instrument, so they must be identified. |
| Pool size N | Integer, header once | 200 | The denominator for every rate and agreement figure. |
| Case ID | Consistent across judges | F-0142 | Agreement is matched on this text, so the format must not drift. |
| Decision | IN / OUT | IN | Every case needs one; marking only inclusions makes kappa impossible. |
| Reason | One line | Amount 4x the vendor median | Turns a judgement into a criterion applied. |
| Criterion met | C1 / C2 / C3 / none | C1 amount | Shows which written rule drove the decision. |
| Confidence | High / Medium / Low | Medium | Low confidence selections are where disagreement concentrates. |
| Time decided | HH:MM | 10:42 | Reveals fatigue and anchoring effects across a long session. |
| Independent? | Yes / No, header once | Yes | Determines whether agreement means reliability or conformity. |
| Notes | Free text, short | Borderline against C2 | Explains anything the decision column cannot. |
Completeness rule: every case in the pool needs a row from every judge. A judge who records only their selections cannot be included in any agreement calculation. Independence rule: sheets stay separate until both are finished; the agreement figure is computed from the independent stage only, even if you reconcile afterwards.
10c. Filled worked recording sheet
| # | Case ID | Judge A | A reason | Judge B | B reason | Outcome |
|---|---|---|---|---|---|---|
| 1 | F-0142 | IN | Amount 4x vendor median | IN | Amount outlier | Unanimous |
| 2 | F-0143 | OUT | Within all thresholds | OUT | Routine | Neither |
| 3 | F-0147 | IN | Posted after period close | OUT | Timing explained by accrual | Singleton A |
| 4 | F-0151 | OUT | Known recurring vendor | IN | Vendor not on approved list | Singleton B |
| 5 | F-0158 | IN | Round sum, no supporting doc | IN | No documentation attached | Unanimous |
| 6 | F-0163 | OUT | Routine | OUT | Routine | Neither |
| 7 | F-0169 | IN | Split just under approval limit | OUT | Two genuine invoices | Singleton A |
| 8 | F-0174 | OUT | Within thresholds | OUT | Routine | Neither |
| 9 | F-0180 | IN | New vendor, first payment large | IN | New vendor risk | Unanimous |
| 10 | F-0186 | OUT | Routine | IN | Manual journal, no approver | Singleton B |
What this sheet shows:
- Every case has a decision from both judges, which is what makes the agreement calculation possible.
- Rows 1, 5 and 9 are unanimous and form the defensible core of the sample.
- Rows 3, 4, 7 and 10 are singletons, and the paired reasons show the judges applied different criteria rather than simply disagreeing.
- Row 3 versus row 4 is instructive: A weights timing, B weights vendor approval. That is a criteria problem, not a competence problem.
- Recording both reasons side by side is what lets you diagnose the disagreement rather than merely counting it.
10d. Blank print ready recording sheet
Download the blank sheet as a .csv file, open it in Excel, Google Sheets or LibreOffice, then print one copy per judge. The Decision and Reason columns for every case in the pool are what make the agreement statistics computable, so they are pre-labelled here even though most templates only capture the selections.
11Which Sampling Method Should You Use?
Decision tree. Answer these in order and stop at the first yes.
- Do you need to project a total or a rate to the whole population with a stated precision? Use a probability design; judgment sampling cannot support projection.
- Are you auditing a monetary population and need both targeting and projection? Use monetary unit sampling, which weights by value while remaining a probability method.
- Do you want to examine the cases most likely to contain the problem, and can you accept that findings do not project? Judgment sampling is the right tool; measure the judgement with this page.
- Do you have two or more experts available? Use judgment sampling with independent parallel judging so reliability is measurable.
- Are you doing qualitative research and need variation, saturation or theory building? Use purposive sampling and our purposive tool instead.
- Do you need fixed counts within subgroups? Use quota sampling.
- Are you selecting whatever is easiest to reach with no analytical rationale? That is convenience sampling; label it honestly.
- Is the population hidden with no frame? Use snowball or respondent driven sampling.
| Method | Targets known risk? | Projects to population? | Reliability measurable? | Effort |
|---|---|---|---|---|
| Judgment sampling | Yes, that is the point | No | Yes, with a second judge | Low |
| Purposive sampling | Yes, by strategy | No | Rarely attempted | Low |
| Monetary unit sampling | Yes, by value | Yes | Not needed | Medium |
| Haphazard sampling | No | No | No | Very low |
| Quota sampling | Partly | No | Partly | Low |
| Simple random | No | Yes | Not needed | Medium |
| Stratified random | Somewhat, by stratum | Yes | Not needed | Medium |
| Systematic | No | Yes | Not needed | Low |
12Troubleshooting and Common Errors
My percent agreement is 95 percent but kappa is only 0.3
Cause: the prevalence paradox. Most of your agreement is on cases neither judge selected. Fix: report kappa and PABAK together, quote the prevalence index, and use Jaccard overlap as the practical figure.
Kappa came out negative
Cause: the judges agreed less often than chance predicts, meaning they are systematically picking different cases. Fix: this is a criteria failure, not a sample size failure. Rewrite the criteria with worked examples and repeat the exercise.
One judge selected 25 cases and the other selected 5
Cause: different thresholds rather than different judgements. Fix: check the bias index. Calibrate on ten shared practice cases until the rates converge, then redo the selection.
Only one expert is available
Cause: the usual constraint. Fix: you cannot compute agreement, so the bias scorecard is your only evidence. Even a colleague re-selecting 30 cases from the pool gives you a partial kappa, which is far better than none.
My judges discussed the cases before deciding
Cause: a natural instinct that destroys the measurement. Fix: the resulting figure describes consensus, not reliability. Report it as consensus and do not call it inter-rater reliability.
A judge only recorded their selections, not their rejections
Cause: the recording sheet allowed it. Fix: kappa requires a decision on every case in the pool. You can reconstruct rejections only if the pool list is complete and the judge confirms the rest were considered and declined.
Case IDs do not match between judges
Cause: inconsistent formats such as F-142 against F-0142. Fix: the tool matches on ID text ignoring case and spacing, but leading zeros differ. Standardise the ID format before comparing.
Kappa is 0.9 and I am suspicious
Cause: healthy suspicion. Very high agreement on a genuinely subjective task usually means the judges were not independent, or the criteria were so mechanical that no judgement was involved. Check which, and say so.
Can I report a margin of error for my judgment sample?
Cause: pressure to look quantitative. Fix: no. There is no sampling distribution behind a judgement. Report the selection rate, the agreement statistics and the bias exposure instead; together they are more informative than a fake interval.
My reviewer says judgment sampling is not acceptable
Cause: often a reasonable objection when projection is required. Fix: if the aim is a population estimate they are right. If the aim is to examine high risk cases, judgment sampling is appropriate and the answer is to evidence the judgement, which is what this page produces.
Uploaded CSV columns loaded with blank values
Cause: empty cells or trailing rows. Fix: the tool skips empty cells automatically, but check the selection count shown on each judge card matches what you expect.
13Assumptions, Bias and Limitations
- No probability basis. Selection probabilities are unknown, so there is no margin of error, no confidence interval and no projection to the population.
- The judge is the instrument. The design inherits every limitation of the person applying it, including their training, assumptions and blind spots.
- Reliability is not validity. Two judges can agree perfectly and both be wrong in the same direction. Agreement measures consistency only.
- Kappa depends on prevalence and marginals. Rare selection depresses kappa and unequal strictness distorts it, which is why PABAK and the two indices are reported alongside.
- Independence assumption. Every agreement figure assumes the judges did not see each other's decisions. If they conferred, the statistic measures conformity.
- Complete pool assumption. Agreement is computed over the candidate pool. A judge who considered a different pool cannot be validly compared.
- The bias index is a self assessment. It carries no sampling theory and corrects nothing; it structures disclosure.
- Two judges is a minimum, not a comfort. Two experts from the same institution are far more likely to share a blind spot than two from different ones.
14Conclusion
What judgment sampling gives you
Judgment sampling concentrates limited effort on the cases most likely to matter. An auditor who examines the twenty most irregular entries learns more about control failure than one who examines twenty entries at random, and an inspector who visits the machines most likely to be failing finds more faults than one following a random schedule. When the aim is detection rather than estimation, deliberately targeting risk is not a weaker method, it is the correct one, and pretending otherwise wastes the expertise you are paying for.
What it costs you
You give up projection entirely. Nothing found in a judgment sample can be extrapolated to the population, because the cases were chosen precisely for being unusual. You also inherit the judge: their training, their recent experience, their institutional assumptions and their cognitive shortcuts all enter the sample invisibly. That is why the two questions worth asking are not about sample size at all, but whether another competent expert would have chosen similarly, and which known heuristics were in play.
What to check before you report
Confirm five things: the judge and their qualification are named, the criteria were written before any case was seen, the candidate pool size and selection rate are stated, agreement was computed from independent judging with kappa and PABAK reported together, and the cases only one judge selected are listed with a reason each. Then state plainly that agreement demonstrates reliability and not validity, because that distinction is the one most often blurred in practice.
What to do next
If your kappa fell below 0.40 the criteria are the problem, and no amount of extra sampling will fix them; rewrite them with worked examples and repeat. If it landed between 0.40 and 0.60, that is a normal and reportable result for expert selection, so publish it openly rather than quietly. If it came in above 0.85, verify that the judges really were independent before treating it as good news. And if you had only one judge, the highest value half day available to you is a colleague re-selecting from the same pool, because a kappa figure is the single most persuasive thing a judgment sample can offer.
15Test Yourself
1. Two judges agree on 96 of 100 cases but kappa is 0.28. What is going on?
Selection is rare, so most of the agreement is on joint exclusions and chance agreement is very high. Report kappa with PABAK and the prevalence index, and use Jaccard overlap as the practical figure.
2. What does a negative kappa mean?
The judges agreed less often than chance would predict, so they are systematically selecting different cases. The criteria are not functioning and should be rewritten.
3. Judge A picked 25 cases, Judge B picked 5. Which statistic flags this?
The bias index, |b − c| / N. It identifies unequal strictness, which is a different problem from disagreeing about individual cases and needs calibration rather than new criteria.
4. Your two judges discussed the cases first and kappa came out at 0.92. Can you report reliability?
No. Agreement between judges who conferred measures conformity. Report it as consensus and state that independent reliability was not assessed.
5. Both judges agree perfectly. Does that mean the sample is correct?
No. Agreement is reliability, not validity. Two experts with the same training can agree completely and share the same blind spot.
6. Can you compute kappa if a judge recorded only the cases they selected?
Not validly. Kappa needs an in or out decision on every case in the candidate pool, because the joint rejections are part of the calculation.
16Frequently Asked Questions
1. What is judgment sampling?
Judgment sampling selects units because an experienced person believes those units are the right ones to examine, rather than by chance. It is a non probability method, also called judgmental, purposive or selective sampling.
2. Is judgment sampling the same as purposive sampling?
They name the same family of designs. Methodology journals prefer purposive; audit, inspection and quality control practice prefer judgment. The practical difference is emphasis: judgment sampling raises the question of how reliable the judge is.
3. What is the difference between judgment sampling and convenience sampling?
Judgment sampling selects cases for a stated expert reason. Convenience sampling selects whoever is easiest to reach. If you cannot say why each case was chosen, it is convenience sampling.
4. Can you calculate a margin of error for a judgment sample?
No. There is no sampling distribution behind a judgement, so no valid margin of error, confidence interval or projection to the population exists.
5. How do you test whether a judgment sample is reliable?
Have two or more experts select independently from the same candidate pool, then compute percent agreement, Cohen kappa, PABAK and Jaccard overlap. Agreement above chance is the evidence that the judgement is reproducible.
6. What is Cohen kappa and how do you calculate it?
Cohen kappa measures agreement above chance for two raters. It equals observed agreement minus expected agreement, divided by one minus expected agreement. Values run from below zero for worse than chance up to one for perfect agreement.
7. How do you interpret a kappa value?
The Landis and Koch bands are conventional: at or below zero poor, 0.01 to 0.20 slight, 0.21 to 0.40 fair, 0.41 to 0.60 moderate, 0.61 to 0.80 substantial, above 0.80 almost perfect. For expert selection, moderate is acceptable and substantial is strong.
8. Why is my kappa low when percent agreement is high?
This is the prevalence paradox. When selection is rare, most agreement comes from cases neither judge chose, so chance agreement is very high and kappa is depressed. Report PABAK and the prevalence index alongside kappa.
9. What is PABAK?
PABAK is the prevalence adjusted bias adjusted kappa, equal to two times observed agreement minus one. It removes the dependence on how often selection occurs, so it should be reported whenever the selection rate is far from 50 percent.
10. What is Fleiss kappa used for?
Fleiss kappa gives one chance corrected agreement figure for three or more raters who each rate every case. It answers whether the panel as a whole is applying a shared standard, and should be reported with the pairwise table beneath it.
11. What is the Jaccard overlap in judgment sampling?
Jaccard overlap is the number of cases both judges selected divided by the number either selected. It ignores joint exclusions entirely, so unlike percent agreement it cannot be inflated by a large candidate pool.
12. What is a negative kappa?
A negative kappa means the judges agreed less often than chance would predict, so they are systematically choosing different cases. This is a criteria failure and the criteria should be rewritten rather than the sample enlarged.
13. What cognitive biases affect judgment sampling?
Eight are well documented in expert selection: anchoring on early cases, availability of memorable cases, confirmation of an existing hypothesis, halo and reputation effects, accessibility, representativeness, salience of extremes, and stakeholder pressure.
14. Does high agreement mean the judgment sample is correct?
No. Agreement measures reliability, not validity. Two experts with the same training can agree perfectly and share the same blind spot, which is why a high kappa with a high bias score is the most misleading combination.
15. Do the judges need to work independently?
Yes, for the agreement figure to mean anything. If judges discussed the cases or saw each other decisions, the resulting statistic measures conformity rather than reliability and should be labelled consensus.
16. How many judges do you need?
Two is the minimum for Cohen kappa and three or more allows Fleiss kappa. Two judges from different institutions are more informative than two from the same one, because shared training produces shared blind spots.
17. When is judgment sampling appropriate?
When the aim is detection rather than estimation: examining the cases most likely to contain a problem, targeting known risk, inspecting suspected failures, or selecting expert informants. It is not appropriate when a population estimate is required.
18. Is judgment sampling acceptable in auditing?
Yes, it is long established practice for targeting risk, but it does not support projection of misstatement to the population. Where projection is required, a statistical method such as monetary unit sampling is used instead.
19. How do you report judgment sampling in a paper or audit file?
Name the judge and their qualification, state the criteria written before any case was seen, give the candidate pool size and selection rate, report agreement from the independent stage with kappa and PABAK, and list the cases only one judge selected with a reason each.
20. What is the difference between reliability, validity and consensus?
Reliability means judges agree with each other and is measured by kappa. Validity means the judges are right and is measured by nothing on this page. Consensus means judges talked and converged, and is evidence of neither.
17Cite This Tool
18Related Tools
- Purposive Sampling Tool for strategy choice, variation coverage and saturation, the qualitative side of the same family.
- Convenience Sampling Calculator and Bias Checker for scoring bias when there was no analytical rationale.
- Simple Random Sampling Calculator for a seeded probability draw when projection is required.
- Stratified Random Sampling Calculator for targeting subgroups while keeping projectability.
- Systematic Sampling Calculator for interval selection with a random start.
19Glossary of Terms
| Term | Meaning |
|---|---|
| Anchoring | Letting the first cases examined set the template for all later decisions. |
| Availability heuristic | Over selecting cases that are memorable or recent rather than relevant. |
| Bias index | |b − c| / N; measures how differently strict the two judges are. |
| Candidate pool | Every unit the judges could have chosen from; the denominator for all agreement figures. |
| Chance agreement | The agreement two judges would reach at random given how often each selects. |
| Cohen kappa | Chance corrected agreement between two raters, from below 0 to 1. |
| Consensus | Agreement reached after discussion; not evidence of reliability. |
| Fleiss kappa | Chance corrected agreement across three or more raters. |
| Halo effect | Judging a case differently because of the reputation attached to it. |
| Jaccard overlap | Cases both judges selected divided by cases either selected. |
| Judgment sampling | Selecting units on expert judgement rather than by chance. |
| Landis and Koch bands | The conventional verbal labels for ranges of kappa. |
| PABAK | Prevalence adjusted bias adjusted kappa, equal to 2 times observed agreement minus 1. |
| Prevalence index | |a − d| / N; high values depress kappa even when agreement is high. |
| Prevalence paradox | The effect whereby rare selection produces low kappa despite high raw agreement. |
| Reliability | Whether judges agree with each other; measured by kappa. |
| Selection rate | Share of the candidate pool a judge selected. |
| Singleton case | A case exactly one judge selected; where the judgement did the work. |
| Unanimity | Share of the flagged pool that every judge selected. |
| Validity | Whether the judges are actually right; not measured by agreement. |
20References
- Cohen, J. (1960). A coefficient of agreement for nominal scales. Educational and Psychological Measurement, 20(1), 37-46. https://doi.org/10.1177/001316446002000104
- Fleiss, J. L. (1971). Measuring nominal scale agreement among many raters. Psychological Bulletin, 76(5), 378-382. https://doi.org/10.1037/h0031619
- Landis, J. R., & Koch, G. G. (1977). The measurement of observer agreement for categorical data. Biometrics, 33(1), 159-174. https://doi.org/10.2307/2529310
- Byrt, T., Bishop, J., & Carlin, J. B. (1993). Bias, prevalence and kappa. Journal of Clinical Epidemiology, 46(5), 423-429. https://doi.org/10.1016/0895-4356(93)90018-V
- Feinstein, A. R., & Cicchetti, D. V. (1990). High agreement but low kappa: I. The problems of two paradoxes. Journal of Clinical Epidemiology, 43(6), 543-549. https://doi.org/10.1016/0895-4356(90)90158-L
- Cicchetti, D. V., & Feinstein, A. R. (1990). High agreement but low kappa: II. Resolving the paradoxes. Journal of Clinical Epidemiology, 43(6), 551-558. https://doi.org/10.1016/0895-4356(90)90159-M
- Sim, J., & Wright, C. C. (2005). The kappa statistic in reliability studies: use, interpretation, and sample size requirements. Physical Therapy, 85(3), 257-268. https://doi.org/10.1093/ptj/85.3.257
- Gwet, K. L. (2014). Handbook of Inter-Rater Reliability (4th ed.). Advanced Analytics. WorldCat record
- Krippendorff, K. (2004). Reliability in content analysis: some common misconceptions and recommendations. Human Communication Research, 30(3), 411-433. https://doi.org/10.1111/j.1468-2958.2004.tb00738.x
- Tversky, A., & Kahneman, D. (1974). Judgment under uncertainty: heuristics and biases. Science, 185(4157), 1124-1131. https://doi.org/10.1126/science.185.4157.1124
- Kahneman, D., Slovic, P., & Tversky, A. (1982). Judgment Under Uncertainty: Heuristics and Biases. Cambridge University Press. https://doi.org/10.1017/CBO9780511809477
- Nickerson, R. S. (1998). Confirmation bias: a ubiquitous phenomenon in many guises. Review of General Psychology, 2(2), 175-220. https://doi.org/10.1037/1089-2680.2.2.175
- Kahneman, D., Sibony, O., & Sunstein, C. R. (2021). Noise: A Flaw in Human Judgment. Little, Brown Spark. WorldCat record
- Meehl, P. E. (1954). Clinical versus Statistical Prediction. University of Minnesota Press. https://doi.org/10.1037/11281-000
- Dawes, R. M., Faust, D., & Meehl, P. E. (1989). Clinical versus actuarial judgment. Science, 243(4899), 1668-1674. https://doi.org/10.1126/science.2648573
- Elder, R. J., Akresh, A. D., Glover, S. M., Higgs, J. L., & Liljegren, J. (2013). Audit sampling research: a synthesis and implications for future research. Auditing: A Journal of Practice and Theory, 32(sp1), 99-129. https://doi.org/10.2308/ajpt-50394
- Hall, T. W., Hunton, J. E., & Pierce, B. J. (2002). Sampling practices of auditors in public accounting, industry, and government. Accounting Horizons, 16(2), 125-136. https://doi.org/10.2308/acch.2002.16.2.125
- Etikan, I., Musa, S. A., & Alkassim, R. S. (2016). Comparison of convenience sampling and purposive sampling. American Journal of Theoretical and Applied Statistics, 5(1), 1-4. https://doi.org/10.11648/j.ajtas.20160501.11
- Baker, R., et al. (2013). Summary report of the AAPOR task force on non probability sampling. Journal of Survey Statistics and Methodology, 1(2), 90-143. https://doi.org/10.1093/jssam/smt008
- Lohr, S. L. (2021). Sampling: Design and Analysis (3rd ed.). CRC Press. https://doi.org/10.1201/9780429298899