

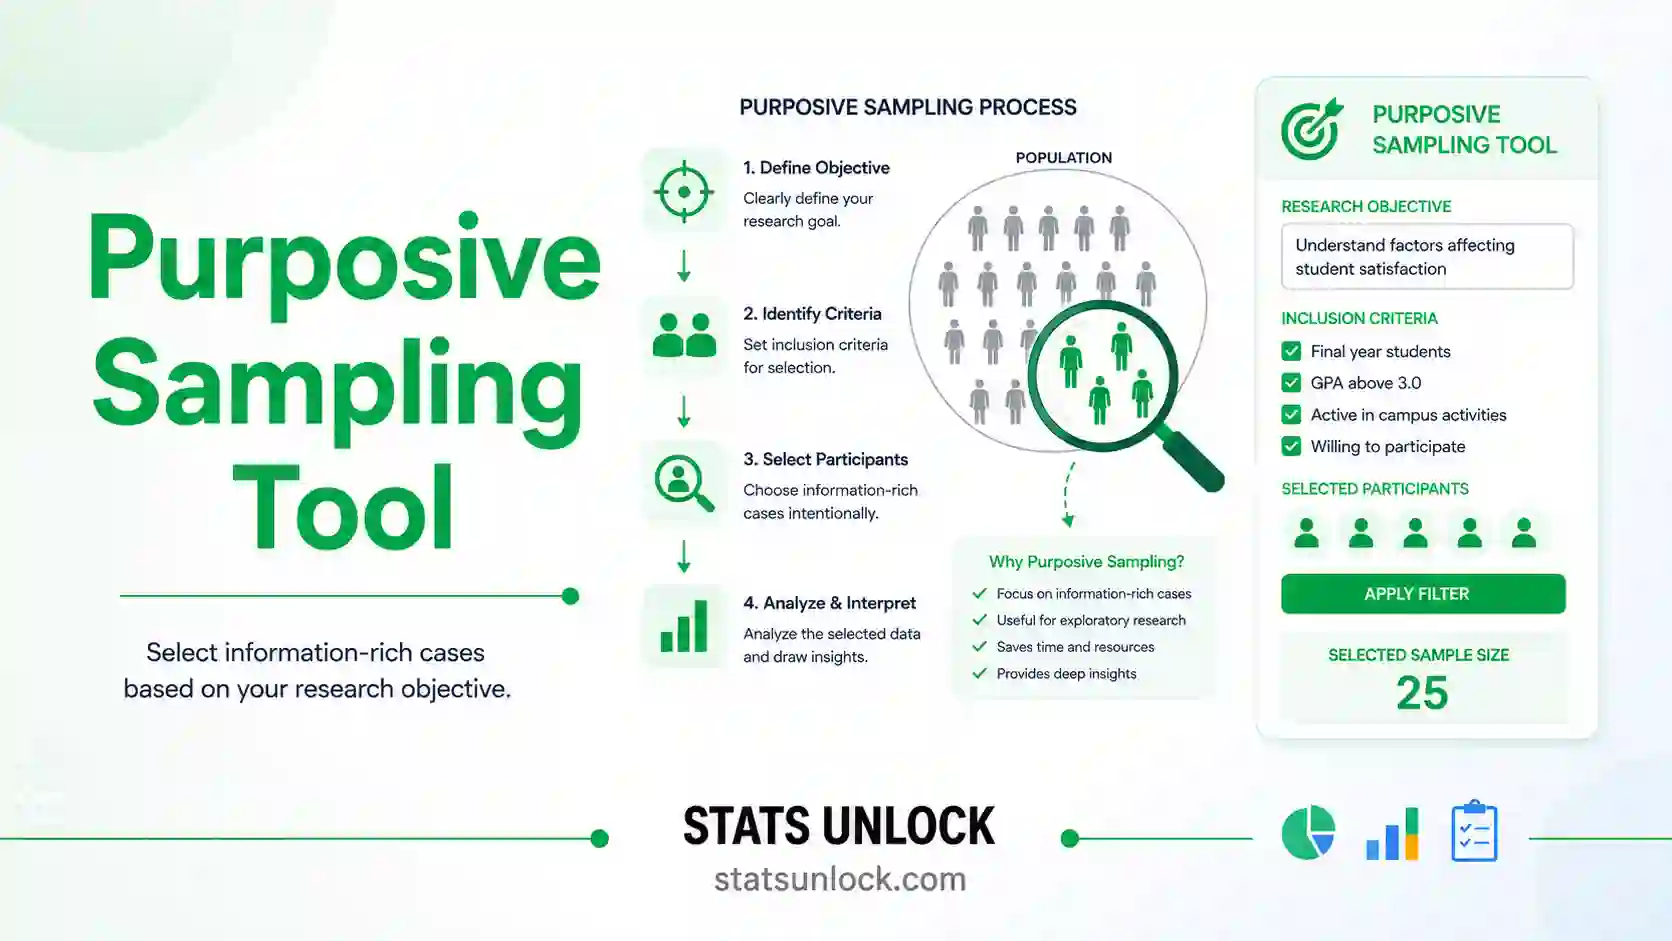

Purposive Sampling Tool
Purposive sampling is judged on the quality of its reasoning, not on a margin of error. This tool recommends one of fifteen purposive strategies from your research aim, turns your inclusion criteria into an auditable case matrix, checks whether your cases actually cover every variation dimension you claimed, and justifies your sample size using information power and a saturation curve.
0Quick Answer
★Key Takeaways
- Purposive sampling is deliberate, not convenient. If you cannot say why each case was chosen, you are doing convenience sampling under a better name.
- Choosing the right strategy is the design decision: maximum variation, typical case, extreme case and critical case answer completely different questions.
- Write inclusion and exclusion criteria before recruiting, so selection is auditable rather than intuitive.
- There is no sample size formula. Use information power: a narrow aim, dense sample, strong theory and good dialogue all reduce the n you need.
- Saturation must be shown, not claimed. Track new codes per case and present the curve.
1What Is Purposive Sampling?
Purposive sampling, also called judgmental or selective sampling, chooses cases deliberately because they possess characteristics the research question requires. A study of how hospitals recover from cyber attacks selects hospitals that have been attacked. A study of exceptional teaching selects teachers identified as exceptional. Nothing is random, and that is the point: random selection would waste most of the sample on cases with nothing to say about the question.
This makes it a non probability design, but for a fundamentally different reason from convenience sampling. Convenience sampling has no rationale beyond access. Purposive sampling has an explicit analytical rationale, and that rationale is the method. When a reviewer evaluates a purposive sample they are not asking whether it is representative, because it was never meant to be. They are asking three things: was the strategy appropriate to the aim, were the selection criteria stated and applied consistently, and is there enough information in the sample to support the claims being made.
The logic is transferability rather than generalisability. A probability sample lets you infer to a population. A purposive sample lets a reader judge whether your findings might apply to their own setting, which requires you to describe your cases in enough detail for that judgement to be possible. That is why a thin methods section damages a purposive study far more than a small n does.
Figure 1.1 Purposive sampling spends the whole sample on cases that can answer the question.
2Setup: Strategy, Criteria and Cases
Information power scorecard
Malterud's five dimensions. Each answer scores 0 for a factor that increases the sample size needed, 1 for neutral and 2 for a factor that reduces it. A higher total means fewer cases are required.
Variation dimensions: one card per dimension
List each dimension that matters to your question, the levels you need covered, and which level each selected case falls into. The tool then shows you exactly which cells are still empty. Dimension names are editable.
3Results
4Interpretation of Results in Detail
How to read each number
The recommended strategy. The tool maps your stated aim onto one of fifteen recognised purposive strategies. This matters more than any other output, because the commonest failure in purposive sampling is a mismatch: selecting typical cases when the question is about failure, or maximally varied cases when the question needs depth in one setting. If the recommendation surprises you, that is worth pausing over before recruiting anyone.
The coverage percentage. For each dimension the tool compares the levels you said you needed against the levels your cases actually occupy. Coverage is the share of required levels with at least one case. This is the single most checkable claim in a maximum variation study: if you write that your sample spans urban, peri-urban and rural settings, a reader can verify it in one glance at the matrix, and so can a reviewer.
The empty cells list. Every level with no case is named explicitly. An empty cell is not automatically a flaw, because some combinations may not exist in reality, but an unexplained empty cell is. The rule for writing up is simple: either fill it or explain it.
Cases per level. Coverage tells you whether a level has any case; this tells you how many. A dimension where one level holds eight cases and another holds one is technically fully covered but practically lopsided, and any comparison you draw across those levels will rest on very unequal evidence.
The information power score. This follows Malterud's model, which replaced the older habit of quoting arbitrary sample sizes. Five factors decide how many cases you need: a narrow aim needs fewer than a broad one, a dense sample of highly specific participants needs fewer than a sparse one, strong existing theory needs fewer than an exploratory study, high quality dialogue needs fewer than thin data, and a case oriented analysis needs fewer than a cross case comparison. A high score means your study carries a lot of information per case, so a smaller sample is defensible.
The suggested sample size range. The tool combines your qualitative design with your information power score to give a band, not a number. Treat it as the range you must justify within, not a target to hit. The published bands are conventions distilled from methodological reviews, and every one of them is routinely and legitimately departed from with a stated reason.
The saturation point. If you entered new codes per case, the tool finds the first case after which your chosen window of consecutive cases each added no more than your threshold of new codes. That is the case at which saturation was reached under your own stated criterion, which is exactly what a reviewer wants to see: a criterion set in advance and then applied, rather than a bare assertion that saturation occurred.
The saturation curve shape. A healthy curve falls steeply then flattens. A curve that is still descending at your last case means you stopped early, whatever your total n was. A curve that is flat from the beginning usually means your coding scheme is too coarse to detect new content, which is a different problem and is not solved by more interviews.
Cumulative codes. The running total shows how much of your final code set each case contributed. If the last three cases contributed two percent of the codes between them, that is a quantitative statement about saturation you can put in a sentence, and it is far more persuasive than the word saturation on its own.
What none of this can tell you. Coverage of the dimensions you chose says nothing about the dimension you failed to think of, and saturation of the codes your framework produces says nothing about the codes a different framework would have produced. Both metrics measure the completeness of your own design against itself. They are necessary, they are checkable, and they are not sufficient.
5How to Write Your Results in Research
Use the templates below. Each one names the strategy, the criteria and the size justification, which is what reviewers look for first in a purposive design.
Rules that make a methods paragraph pass review
- Name the specific strategy, not just "purposive". Write "maximum variation sampling" or "critical case sampling"; the generic label tells a reader nothing.
- Give the rationale in one sentence. Why these cases and not others is the entire method, so it belongs in the first two lines.
- List inclusion and exclusion criteria explicitly. A bulleted list is better than prose, and it makes the selection auditable.
- Show the variation table. Dimensions down the side, levels across the top, counts in the cells. It converts a claim into evidence.
- Explain every empty cell. Either the combination does not exist, or you could not access it, or you chose not to pursue it. Say which.
- Justify n by information power, not by convention. Cite the five factors and say which of them apply to your study.
- Demonstrate saturation rather than asserting it. State the criterion you set in advance and report the new codes per case that met it.
- Describe your cases richly enough for transferability. The reader must be able to judge whether your setting resembles theirs.
- Say who identified the cases. If a gatekeeper nominated participants, that is a selection mechanism and must be reported.
- Do not use the language of representativeness. Purposive samples are information rich, not representative, and mixing the vocabularies invites criticism.
Common wording mistakes and the fix
| Wrong wording | Why it fails | Correct wording |
|---|---|---|
| "Participants were selected purposively." | Names no strategy and gives no rationale. | "Maximum variation sampling was used to span three settings and two seniority levels." |
| "The sample was representative of teachers." | Applies probability language to a purposive design. | "The sample was selected for information richness across the dimensions specified below; it is not representative." |
| "Data collection continued until saturation was reached." | Asserts saturation without evidence or criterion. | "Saturation was defined in advance as three consecutive interviews adding one or fewer new codes; this occurred at interview 9." |
| "Twelve participants were interviewed, which is standard." | Convention is not a justification. | "Twelve participants were sufficient given the narrow aim, dense sample and strong prior theory (information power)." |
| "A convenience sample of experts was used." | If experts were chosen for their expertise, it was purposive. | "Expert sampling was used; participants were selected against three stated criteria of domain expertise." |
6Formulas Used
7How to Use This Tool
- Type your study name and, in one line, the rationale for choosing these cases rather than others.
- Select your research aim from the dropdown; the tool maps it to a named purposive strategy.
- Choose your qualitative design so the sample size guidance uses the right conventional band.
- Answer the five information power questions honestly. A narrow aim and dense sample genuinely do justify fewer cases.
- Add one card per variation dimension, for example setting, seniority, or years of experience.
- In each card's levels box, list every level you need covered, separated by commas.
- In the textarea, list which level each selected case falls into, one entry per case, in the same case order across all dimensions.
- Enter the new codes produced by each case if you are tracking saturation, and set your window and threshold in advance.
- Click Assess Strategy and Coverage, then read the strategy card and the empty cells list first.
- Copy the methods paragraph into your manuscript and download the sampling plan for your supervisor or ethics committee.
8Detailed Reference Tables
Table 8.1 The fifteen purposive sampling strategies
| Strategy | Selects | Answers the question | Typical n |
|---|---|---|---|
| Maximum variation | Cases spanning the widest range of key dimensions | What patterns hold across very different cases? | 12 to 30 |
| Homogeneous | Cases that are alike on the key dimensions | What is going on in depth within one group? | 6 to 12 |
| Typical case | Cases that are average or normal | What does the usual situation look like? | 5 to 15 |
| Extreme or deviant case | Outstanding successes or notable failures | What happens at the limits? | 3 to 10 |
| Intensity | Cases with a strong but not extreme manifestation | What does a rich example look like? | 6 to 15 |
| Critical case | Cases where the effect should appear if anywhere | If not here, then nowhere? | 1 to 5 |
| Confirming and disconfirming | Cases that support or challenge an emerging finding | Does the pattern survive a hard test? | 3 to 10 added later |
| Theoretical | Cases chosen as theory develops | What does the emerging theory now require? | 20 to 30 |
| Criterion | Every case meeting a defined condition | What is true of all who meet this condition? | Varies with the condition |
| Stratified purposive | Cases within predefined subgroups | How do defined subgroups compare? | 3 to 6 per subgroup |
| Expert | People with specialist knowledge | What do those who know best say? | 8 to 20 |
| Snowball or chain | Cases nominated by earlier participants | How do I reach a hidden group? | 10 to 30 |
| Politically important | Cases with strategic significance | Which cases will influence practice? | 3 to 10 |
| Opportunistic or emergent | Cases arising unexpectedly during fieldwork | What does this unplanned opening reveal? | Varies |
| Total population | Every case meeting a narrow definition | What is true of the entire small population? | All of them |
Table 8.2 Information power: the five dimensions
| Dimension | Needs more cases | Needs fewer cases |
|---|---|---|
| Study aim | Broad, exploratory aim | Narrow, tightly specified aim |
| Sample specificity | Sparse: participants vary widely in relevance | Dense: every participant is highly relevant |
| Use of theory | No established theoretical framework | Applied, well established theory |
| Quality of dialogue | Short or weak interviews, limited rapport | Long, rich interviews with strong rapport |
| Analysis strategy | Cross case comparison across many cases | In depth analysis of individual narratives |
Table 8.3 Conventional sample size bands by qualitative design
| Design | Common range | Driver of the number |
|---|---|---|
| Case study | 1 to 5 cases | Depth per case, not count of cases |
| Phenomenology | 5 to 25 participants | Shared lived experience of one phenomenon |
| Grounded theory | 20 to 30 participants | Theoretical saturation of categories |
| Ethnography | 30 to 50, or one setting | Prolonged engagement in the field |
| Qualitative content or thematic analysis | 10 to 30 | Code saturation across the corpus |
| Narrative inquiry | 1 to 10 | Depth and completeness of each story |
| Delphi or expert panel | 8 to 20 experts | Stability of consensus across rounds |
Table 8.4 Interpreting coverage and saturation
| Indicator | Good | Acceptable | Problem |
|---|---|---|---|
| Overall coverage | 100 percent | 85 to 99 percent with cells explained | Below 85 percent, or cells unexplained |
| Balance within a dimension | Above 0.6 | 0.34 to 0.6 | Below 0.34, comparisons lopsided |
| Cases per filled level | 2 or more | 1 with rich data | 1 with thin data |
| Saturation reached | With 3 or more cases to spare | At the final case | Never reached |
| Last window contribution | Under 5 percent of codes | 5 to 15 percent | Above 15 percent |
9Example Results (8 Worked Cards)
Example 1. Maximum variation: teacher retention across settings
3 dimensions, 14 cases, phenomenology
Figure 9.1 Coverage span across the required levels, shown as a range.
| Coverage | Information power | Suggested n | Saturation | Verdict |
|---|---|---|---|---|
| 100% | 60 / 100 | 9 to 20 | case 11 of 14 | Defensible |
What it means: All three dimensions are fully covered and saturation arrived at case 11 with three cases to spare. The last three interviews added two codes between them, 1.4 percent of the total, which is quantitative evidence rather than an assertion.
How to write it: Maximum variation sampling was used across school setting (urban, peri-urban, rural), seniority (early, mid, late career) and school size (small, large). Fourteen teachers were interviewed. Saturation, defined in advance as three consecutive interviews adding one or fewer new codes, was reached at interview 11.
Example 2. Maximum variation with an empty cell
3 dimensions, 9 cases, thematic analysis
Figure 9.2 New codes contributed by each case, drawn as vertical bars against the average.
| Coverage | Information power | Suggested n | Saturation | Verdict |
|---|---|---|---|---|
| 89% | 50 / 100 | 11 to 26 | not reached | Explain the gap |
What it means: One cell is empty: no case represents the rural late career level. Coverage of 89 percent is acceptable only if that gap is explained in the text. Saturation was never reached, so the curve was still descending when collection stopped.
How to write it: No participants were recruited in the rural late career stratum despite three approaches; this gap is acknowledged as a limitation. New codes were still emerging at the final interview, so saturation was not claimed.
Example 3. Critical case: does the system fail where it should hold?
1 case, no dimensions, case study
Figure 9.3 Cases per level compared side by side as horizontal bars.
| Coverage | Information power | Suggested n | Saturation | Verdict |
|---|---|---|---|---|
| n/a | 80 / 100 | 1 to 3 | n/a | Defensible |
What it means: Critical case sampling needs no variation matrix. The logic is if not here then nowhere, so a single well argued case carries the whole design. Information power is high because the aim is narrow and the theory is well established.
How to write it: A critical case design was used: the hospital selected had the strongest resourcing and governance in the region, so a failure of the protocol there implies failure elsewhere.
Example 4. Homogeneous sampling for depth in one group
2 dimensions, 8 cases, phenomenology
Figure 9.4 Every selected case shown as one dot across the variation space.
| Coverage | Information power | Suggested n | Saturation | Verdict |
|---|---|---|---|---|
| 100% | 70 / 100 | 6 to 15 | case 7 of 8 | Defensible |
What it means: Homogeneous sampling narrows rather than widens, so the dimensions here confirm similarity rather than span variation. High information power from a dense, highly specific sample justifies only eight participants.
How to write it: Homogeneous purposive sampling was used to recruit eight first year nurses on night rotation in a single hospital, chosen for their shared exposure to the phenomenon under study.
Example 5. Stratified purposive comparison across subgroups
2 dimensions, 12 cases, 4 per subgroup
Figure 9.5 Saturation curve: new codes per case plotted in collection order.
| Coverage | Information power | Suggested n | Saturation | Verdict |
|---|---|---|---|---|
| 100% | 55 / 100 | 10 to 24 | case 10 of 12 | Defensible |
What it means: Balance is 1.00 because each of the three subgroups holds exactly four cases, so comparisons across subgroups rest on equal evidence. That balance is what stratified purposive sampling exists to achieve.
How to write it: Stratified purposive sampling placed four participants in each of three programme types, giving equal analytic weight to each subgroup in the cross case comparison.
Example 6. Lopsided coverage, technically complete
2 dimensions, 11 cases, balance 0.13
Figure 9.6 Distribution of cases across the levels of one dimension.
| Coverage | Information power | Suggested n | Saturation | Verdict |
|---|---|---|---|---|
| 100% | 45 / 100 | 12 to 28 | case 9 of 11 | Rebalance |
What it means: Every level has at least one case so coverage reads 100 percent, but one level holds eight cases and another holds one. Any comparison across those levels rests on wildly unequal evidence, which coverage alone does not reveal.
How to write it: Although all levels were represented, the distribution was uneven (8, 2 and 1 cases), so cross level comparisons are reported as indicative rather than analytic.
Example 7. Theoretical sampling in grounded theory
cases added iteratively, 24 total
Figure 9.7 Share of the sample falling in each category.
| Coverage | Information power | Suggested n | Saturation | Verdict |
|---|---|---|---|---|
| 100% | 40 / 100 | 18 to 41 | case 21 of 24 | Defensible |
What it means: In theoretical sampling the dimensions are not fixed in advance; they emerge and the matrix grows. Coverage reaching 100 percent by case 24 with saturation at 21 is the pattern grounded theory expects.
How to write it: Theoretical sampling was used: after initial open coding, subsequent participants were selected to develop the properties of emerging categories until no new properties appeared at interview 21.
Example 8. Expert panel with no variation matrix
12 experts, Delphi, no dimensions
Figure 9.8 Spread of case characteristics within each subgroup.
| Coverage | Information power | Suggested n | Saturation | Verdict |
|---|---|---|---|---|
| n/a | 75 / 100 | 6 to 14 | round 3 | Defensible |
What it means: Expert sampling is judged on the stated expertise criteria rather than on coverage. Here three criteria were applied and documented for each panellist, which is what makes the selection auditable in the absence of a matrix.
How to write it: Twelve experts were selected against three criteria: at least ten years in the field, a peer reviewed publication on the topic, and current practice involvement. Consensus stabilised at round three.
10How to Collect Raw Data in the Field
10a. The 18 point field protocol for purposive sampling
Plan
- Write the selection rationale before you recruit anyone. One sentence saying why these cases and not others. If you cannot write it, you do not yet have a purposive design.
- Name the specific strategy from the fifteen recognised variants, and check it against your aim rather than against what is easiest to recruit.
- Write inclusion and exclusion criteria as a numbered list, not as prose, so a second researcher could apply them to the same candidate and reach the same decision.
- List the variation dimensions and their levels that your findings will claim to span, and build the empty matrix now so you can watch it fill.
- Set your saturation criterion in advance: how many consecutive cases adding how few new codes will count as saturation. Deciding this afterwards is what reviewers object to.
Figure 10.1 The matrix built empty at the design stage is what turns a coverage claim into evidence.
Kit
- Carry the criteria list and the matrix to every recruitment conversation, so eligibility is checked against the written rule rather than judged on the spot.
- Carry a screening form that records each candidate against every criterion, including candidates you turn down.
- Carry a recorder with spare batteries and a backup device. In a purposive design each interview is a large share of the total evidence, so a lost recording is disproportionately costly.
- Carry two pencils and a waterproof cover for the field notebook.
Select
- Screen every candidate against the written criteria and record the outcome, including the reason for exclusion. That record is the audit trail.
- Fill the sparsest cells first. The natural pull is toward whoever is easiest to reach, which quietly converts a purposive design into a convenience one.
- Record who nominated each case. If a gatekeeper suggested participants, that is a selection mechanism and must appear in the methods section.
Figure 10.2 The screening form turns inclusion criteria from a stated intention into a documented procedure.
Collect
- Record the level of every dimension for each case at the point of consent, not from memory afterwards, because the matrix depends on it.
- Code each transcript before recruiting the next case where the design allows, so the new codes count is real and saturation can guide recruitment.
- Log the count of genuinely new codes per case in a running table, separating new codes from repeat codes.
Figure 10.3 The saturation log with a criterion set in advance is evidence; the word saturation on its own is not.
Figure 10.4 Only genuinely new content counts toward saturation; merges reduce the running total rather than adding to it.
Check
- After every third case, review the matrix and redirect recruitment toward the emptiest cells while there is still time.
- Before stopping, confirm your saturation criterion has actually been met, and confirm no required level is still empty and unexplained.
- Write the case description table the same week, because transferability depends on readers being able to picture your cases, and that detail fades fast.
Figure 10.5 Four conditions that decide whether a purposive sample is finished, none of which is a target n.
10b. Datasheet column specification
| Column | Format | Example | Why it matters |
|---|---|---|---|
| Study name | Text, header once | Teacher retention study | Links the sheet to the sampling plan. |
| Strategy | Text, header once | Maximum variation | The named strategy, not the generic word purposive. |
| Selection rationale | Text, header once | Teachers who stayed 5+ years | The single most important line in the methods section. |
| Case ID | Prefix plus number | C-014 | Runs across all candidates, included and excluded. |
| Criterion 1, 2, 3 | Tick or cross per criterion | ✓ ✗ ✓ | Makes eligibility auditable case by case. |
| Decision | Include / Exclude | Include | With the reason, forms the selection audit trail. |
| Exclusion reason | Short text | Under 2 years in post | Shows the criteria were applied, not improvised. |
| Dimension levels | One column per dimension | Rural, Late career | Populates the coverage matrix. |
| Nominated by | Self / Gatekeeper / Referral | Gatekeeper | A gatekeeper nomination is a selection mechanism and must be reported. |
| New codes | Integer | 6 | Drives the saturation curve; count only genuinely new content. |
| Cumulative codes | Integer | 45 | Shows how much each case added to the final code set. |
| Notes | Free text, short | Interview cut short at 30 min | Affects the quality of dialogue and therefore information power. |
Exclusion rule: excluded candidates never appear in the analysis but must appear on the screening sheet, because the exclusions are what prove the criteria were applied. Code rule: count only content not seen before; a familiar theme from a new speaker is a repeat, not a new code.
10c. Filled worked datasheet
| # | Case ID | C1 | C2 | C3 | Decision | Setting | Career stage | Nominated by | New codes | Cum. |
|---|---|---|---|---|---|---|---|---|---|---|
| 1 | C-001 | ✓ | ✓ | ✓ | Include | Urban | Early | Self | 18 | 18 |
| 2 | C-002 | ✓ | ✓ | ✓ | Include | Rural | Late | Referral | 12 | 30 |
| 3 | C-003 | ✓ | ✗ | ✓ | Exclude | — | — | Self | — | — |
| 4 | C-004 | ✓ | ✓ | ✓ | Include | Peri-urban | Mid | Gatekeeper | 9 | 39 |
| 5 | C-005 | ✓ | ✓ | ✓ | Include | Rural | Early | Referral | 6 | 45 |
| 6 | C-006 | ✗ | ✓ | ✓ | Exclude | — | — | Gatekeeper | — | — |
| 7 | C-007 | ✓ | ✓ | ✓ | Include | Urban | Late | Self | 4 | 49 |
| 8 | C-008 | ✓ | ✓ | ✓ | Include | Peri-urban | Late | Referral | 2 | 51 |
| 9 | C-009 | ✓ | ✓ | ✓ | Include | Urban | Mid | Self | 1 | 52 |
| 10 | C-010 | ✓ | ✓ | ✓ | Include | Rural | Mid | Referral | 0 | 52 |
What this sheet shows:
- Rows 3 and 6 are excluded candidates that still appear, because the exclusions are what demonstrate the criteria were applied consistently.
- The Setting and Career stage columns fill the coverage matrix: all three settings and all three career stages are represented by case 10.
- The New codes column falls 18, 12, 9, 6, 4, 2, 1, 0, so three consecutive cases at or below one new code are reached by case 10.
- The last three included cases contributed 3 of 52 codes, under 6 percent, which is a quantitative saturation statement.
- Two participants were nominated by a gatekeeper, which is recorded so it can be reported as a selection mechanism.
10d. Blank print ready datasheet
Download the blank sheet as a .csv file, open it in Excel, Google Sheets or LibreOffice, then print it. The criterion tick columns and the exclusion reason column are what make a purposive sample auditable, so they are pre-labelled here even though most templates leave them out.
11Which Sampling Method Should You Use?
Decision tree. Answer these in order and stop at the first yes.
- Do you need to estimate a population quantity with a margin of error? Use a probability design; purposive sampling cannot do this.
- Can you say why each case was chosen, in analytical terms? If not, you are doing convenience sampling and should call it that.
- Do you want patterns that hold across very different contexts? Use maximum variation sampling.
- Do you want depth within one tightly defined group? Use homogeneous sampling.
- Are you testing whether something holds where it most should? Use critical case sampling, where one case can be enough.
- Are you building theory and letting the data direct the next case? Use theoretical sampling.
- Do you need fixed numbers in predefined subgroups for a comparison? Use stratified purposive or quota sampling.
- Is the group hidden with no frame at all? Use snowball or, if you need estimates, respondent driven sampling.
| Method | Probability? | Selection basis | Judged on | Typical n | Generalises? |
|---|---|---|---|---|---|
| Purposive | No | Analytical rationale | Rationale, coverage, saturation | 3 to 30 | Transferability only |
| Convenience | No | Ease of access | Bias disclosure | Any | No |
| Quota | No | Fixed subgroup counts | Composition control | Varies | No |
| Snowball | No | Participant nomination | Chain documentation | 10 to 30 | No |
| Respondent driven | Approximately | Nomination with weights | Recruitment tree | 100 plus | With adjustment |
| Theoretical | No | Emerging theory | Category saturation | 20 to 30 | Analytical only |
| Simple random | Yes | Chance | Margin of error | Large | Yes |
| Stratified | Yes | Chance within strata | Design effect | Large | Yes |
12Troubleshooting and Common Sampling Errors
A reviewer says my purposive sample is really a convenience sample
Cause: no stated rationale, or a rationale that amounts to availability. Fix: if you genuinely selected for a characteristic, state the characteristic and the criteria. If you did not, relabel the study honestly; that is a smaller problem than being caught.
One cell in my matrix is empty and I cannot fill it
Cause: the combination may be rare, inaccessible or non existent. Fix: say which of those three it is. An explained empty cell is acceptable; an unexplained one looks like an oversight.
My supervisor wants a sample size calculation
Cause: an expectation carried over from quantitative work. Fix: there is no valid formula. Present the information power argument across the five dimensions plus the conventional band for your design, and cite the methodological source.
New codes were still appearing at my final interview
Cause: saturation was not reached. Fix: report that honestly, present the curve, and frame your findings as preliminary. Claiming saturation against a curve that is still descending is the error reviewers catch most often.
My saturation curve was flat from the very first case
Cause: usually a coding scheme too coarse to detect new content, not genuine early saturation. Fix: recode a sample of transcripts at a finer grain before concluding anything about saturation.
All my levels are covered but one holds eight cases and another holds one
Cause: recruitment followed access rather than the matrix. Fix: coverage is complete but balance is poor. Report the counts per level and treat cross level comparisons as indicative rather than analytic.
A gatekeeper chose my participants for me
Cause: common in school, clinic and workplace research. Fix: this is a real selection mechanism. Report who nominated participants and on what basis, and discuss what kind of person a gatekeeper is likely to have avoided.
I changed my inclusion criteria partway through
Cause: the field taught you something. Fix: this is legitimate in theoretical sampling and acceptable elsewhere if disclosed. Report the original criteria, the change, the reason and which cases were recruited under each version.
My strategy does not match my aim
Cause: the strategy was chosen by habit or by what was recruitable. Fix: check the recommendation in this tool against what you actually did. If they disagree, either justify the difference explicitly or reconsider the design before collecting more data.
Can I combine purposive with random selection?
Cause: a reasonable ambition. Fix: yes, this is random purposive sampling: define the eligible pool purposively, then select randomly within it. It adds credibility when the eligible pool is larger than you can study.
Uploaded CSV columns loaded with blank values
Cause: mixed or empty cells, or trailing empty rows. Fix: the tool skips empty cells automatically, but check the case count shown on each dimension card matches what you expect.
13Assumptions, Bias and Limitations
- No probability basis. Selection probabilities are unknown and deliberately unequal, so no margin of error, confidence interval or population estimate is available.
- Researcher judgement is the instrument. The quality of the sample rests entirely on the quality of the selection reasoning, which is why the rationale must be written down and defended.
- Dimension blindness. Coverage is measured only against the dimensions you thought of. The variable you failed to consider is invisible to every metric here.
- Coding scheme dependence. Saturation is saturation of your codes under your framework. A different analyst with a different framework would saturate at a different point.
- Confirmation risk. Selecting cases you expect to be informative can shade into selecting cases you expect to agree with you. Disconfirming case sampling is the standard defence.
- Gatekeeper effects. When a third party nominates cases, their preferences enter the design silently unless documented.
- Transferability, not generalisability. Findings travel only as far as a reader's judgement that their setting resembles yours, which depends on how richly you described your cases.
- Information power is a judgement, not a measurement. The score is a structured way of arguing for your n; it carries no sampling theory.
14Conclusion
What purposive sampling gives you
Purposive sampling spends the entire sample on cases that can answer the question. Where a probability design would scatter effort across a population most of whom have nothing relevant to say, purposive sampling concentrates it on the people, sites or events that carry the information. For a study of rare events, exceptional performance, expert judgement or lived experience it is not a weaker alternative to random sampling but a categorically different and more appropriate tool. It also scales down honestly: a single critical case, properly argued, can settle a question that a thousand random cases would not.
What it costs you
You give up inference to a population and you take on the burden of justification. Every case must be defensible, the criteria must be written and applied consistently, and the reasoning must be visible to a reader who was not there. The design also depends completely on the dimensions you thought to specify: coverage of your own matrix says nothing about the factor you never considered, and saturation of your own codes says nothing about the codes a different framework would have produced. Both metrics measure your design against itself.
What to check before you publish
Confirm five things: the specific strategy is named rather than the generic word purposive, the selection rationale appears in the first two lines of the methods, inclusion and exclusion criteria are listed explicitly, every empty cell in the variation matrix is either filled or explained, and the sample size is justified by information power with a saturation criterion that was set in advance and then demonstrated. Add rich case descriptions so a reader can judge transferability to their own setting, and report any gatekeeper involvement in nomination.
What to do next
If a cell is still empty, decide now whether to fill it, merge the level into a neighbouring one, or narrow the claim your paper makes about coverage. If saturation was not reached, either continue recruiting or reframe the findings as preliminary; there is no third option that survives review. And if the strategy this tool recommends differs from the one you used, that mismatch is worth resolving in writing before you submit, because a reviewer who spots it will ask the same question you would rather have answered yourself.
15Test Yourself
1. What separates purposive sampling from convenience sampling?
A stated analytical rationale. Purposive sampling selects cases because of a characteristic the research needs; convenience sampling selects whoever is easiest to reach. If you cannot say why each case was chosen, it is convenience sampling.
2. You want patterns that hold across very different contexts. Which strategy?
Maximum variation sampling. It deliberately spans the widest range of key dimensions, so any pattern appearing across very different cases is likely to be a core pattern.
3. How many cases do you need for purposive sampling?
There is no formula. Use information power: a narrow aim, a dense sample, strong theory, high quality dialogue and a case oriented analysis all reduce the number required.
4. What makes a saturation claim credible?
A criterion set in advance, such as three consecutive cases adding one or fewer new codes, followed by evidence that the criterion was met. The word saturation on its own is an assertion, not evidence.
5. Your matrix shows 100 percent coverage but one level holds eight cases and another holds one. Is that fine?
Coverage is complete but balance is poor. Any comparison across those levels rests on very unequal evidence, so report the counts and treat the comparison as indicative.
6. When can one case be enough?
In critical case sampling, where the case is chosen because the effect should appear there if anywhere. The logic is if not here then nowhere, and it can carry a whole study when the argument is made explicitly.
16Frequently Asked Questions
1. What is purposive sampling?
Purposive sampling deliberately selects cases because they have characteristics the research needs, such as being typical, extreme or maximally varied. It is a non probability method chosen for information richness rather than representativeness.
2. What is the difference between purposive and convenience sampling?
Convenience sampling takes whoever is easiest to reach. Purposive sampling selects specific cases for a stated analytical reason. If you cannot say why each case was chosen, it is convenience sampling under a better name.
3. Is purposive sampling qualitative or quantitative?
It is used mainly in qualitative research, but it also appears in quantitative work for expert panels, case selection in comparative studies and pilot testing. The design logic is the same in both.
4. What are the types of purposive sampling?
Fifteen are commonly recognised: maximum variation, homogeneous, typical case, extreme or deviant case, intensity, critical case, confirming and disconfirming, theoretical, criterion, stratified purposive, expert, snowball, politically important, opportunistic and total population.
5. What is maximum variation sampling?
Maximum variation sampling deliberately selects cases spanning the widest range of a few key dimensions, so that any pattern appearing across very different cases is likely to be a core pattern rather than a local one.
6. What is critical case sampling?
Critical case sampling selects the case where the effect should appear if it appears anywhere. The logic is if not here then nowhere, and a single well argued case can carry the design.
7. What is theoretical sampling?
Theoretical sampling, used in grounded theory, selects each new case based on what the emerging theory needs next. The sample is not fixed in advance; it grows in response to the analysis.
8. How many participants do you need for purposive sampling?
There is no formula. Use information power. Typical bands run from 1 to 5 for case studies, 5 to 25 for phenomenology, 20 to 30 for grounded theory and 30 to 50 for ethnography, but every band is legitimately departed from with a stated reason.
9. What is information power in qualitative sampling?
The concept from Malterud and colleagues that the number of cases needed depends on five factors: study aim, sample specificity, use of theory, quality of dialogue and analysis strategy. More information per case means fewer cases are needed.
10. What is data saturation in purposive sampling?
Saturation is the point at which additional cases stop producing new codes or themes. It should be demonstrated by tracking new codes per case against a criterion set in advance, not simply asserted.
11. How do you demonstrate saturation?
Set a criterion before collecting, such as three consecutive cases adding one or fewer new codes, then report the case number at which it was met and the share of the final code set contributed by the last few cases.
12. How do you write inclusion and exclusion criteria?
List them as numbered rules rather than prose, so that a second researcher applying them to the same candidate would reach the same decision. Record the outcome for every candidate, including those excluded.
13. Can purposive sampling be generalised?
Not statistically. It supports transferability, meaning a reader can judge whether the findings might apply to their own setting, which requires you to describe your cases in rich detail.
14. What is the difference between purposive and quota sampling?
Quota sampling fixes how many cases to collect in each subgroup and then fills the quotas however it can. Purposive sampling selects each case for its analytical value, which may or may not involve fixed counts.
15. What is stratified purposive sampling?
Stratified purposive sampling selects a small number of cases within each of several predefined subgroups, so that comparisons across subgroups rest on equal analytic weight.
16. Is snowball sampling a type of purposive sampling?
It is usually classed as purposive because participants are nominated for their relevance to the topic. It differs in that the researcher does not control selection directly, which introduces network bias.
17. What is the difference between purposive and judgmental sampling?
They are the same thing. Judgmental sampling and selective sampling are older names for purposive sampling; use purposive because it is the term journals expect.
18. Can you combine purposive and random sampling?
Yes. Random purposive sampling defines an eligible pool purposively then selects randomly within it. It adds credibility when the eligible pool is larger than you can study.
19. How do you report purposive sampling in a research paper?
Name the specific strategy, give the rationale in one sentence, list the inclusion and exclusion criteria, present a variation table with any empty cells explained, justify the sample size by information power, and demonstrate saturation against a pre set criterion.
20. What is a variation or coverage matrix?
A table with dimensions down the side and levels across the top, showing how many selected cases fall in each cell. It converts a claim that your sample spans a range into evidence a reader can check.
17Cite This Tool
18Related Tools
- Convenience Sampling Calculator and Bias Checker for scoring bias in a non probability sample.
- Simple Random Sampling Calculator for a seeded probability draw.
- Systematic Sampling Calculator for interval k with a random start.
- Stratified Random Sampling Calculator for proportional, equal and Neyman allocation.
- Proportionate Stratified Sampling Calculator with a self weighting check.
19Glossary of Terms
| Term | Meaning |
|---|---|
| Analytic generalisation | Extending findings to theory rather than to a population. |
| Confirming and disconfirming cases | Cases sought late in a study to test whether an emerging pattern holds. |
| Coverage matrix | A table of dimensions by levels showing how many cases fall in each cell. |
| Criterion sampling | Selecting every case that meets a defined condition. |
| Critical case | A case chosen because the effect should appear there if anywhere. |
| Deviant case | An unusual case at the extreme of a distribution, selected for what the extreme reveals. |
| Dimension | A characteristic along which cases are deliberately varied, such as setting or seniority. |
| Homogeneous sampling | Selecting cases that are alike, in order to study one group in depth. |
| Information power | The idea that richer, more specific cases reduce the number of cases needed. |
| Level | One of the values a dimension can take, such as urban within setting. |
| Maximum variation | Selecting cases that span the widest range of the key dimensions. |
| Non probability sampling | Any design in which selection probabilities are unknown. |
| Purposive sampling | Deliberate selection of cases for a stated analytical reason. |
| Saturation | The point at which new cases stop producing new codes or themes. |
| Screening form | The record of each candidate assessed against every inclusion criterion. |
| Theoretical sampling | Selecting each new case according to what the emerging theory requires. |
| Thick description | Detailed case description that allows a reader to judge transferability. |
| Transferability | The extent to which findings may apply to another setting, judged by the reader. |
| Typical case | A case chosen because it is normal or average for the population of interest. |
| Total population sampling | Including every case that meets a narrow definition, when the group is small. |
20References
- Patton, M. Q. (2015). Qualitative Research and Evaluation Methods (4th ed.). SAGE. Publisher page
- Palinkas, L. A., et al. (2015). Purposeful sampling for qualitative data collection and analysis in mixed method implementation research. Administration and Policy in Mental Health, 42(5), 533-544. https://doi.org/10.1007/s10488-013-0528-y
- Malterud, K., Siersma, V. D., & Guassora, A. D. (2016). Sample size in qualitative interview studies: guided by information power. Qualitative Health Research, 26(13), 1753-1760. https://doi.org/10.1177/1049732315617444
- Guest, G., Bunce, A., & Johnson, L. (2006). How many interviews are enough? An experiment with data saturation and variability. Field Methods, 18(1), 59-82. https://doi.org/10.1177/1525822X05279903
- Hennink, M., & Kaiser, B. N. (2022). Sample sizes for saturation in qualitative research: a systematic review of empirical tests. Social Science and Medicine, 292, 114523. https://doi.org/10.1016/j.socscimed.2021.114523
- Saunders, B., et al. (2018). Saturation in qualitative research: exploring its conceptualization and operationalization. Quality and Quantity, 52(4), 1893-1907. https://doi.org/10.1007/s11135-017-0574-8
- Guest, G., Namey, E., & Chen, M. (2020). A simple method to assess and report thematic saturation in qualitative research. PLOS ONE, 15(5), e0232076. https://doi.org/10.1371/journal.pone.0232076
- Etikan, I., Musa, S. A., & Alkassim, R. S. (2016). Comparison of convenience sampling and purposive sampling. American Journal of Theoretical and Applied Statistics, 5(1), 1-4. https://doi.org/10.11648/j.ajtas.20160501.11
- Suri, H. (2011). Purposeful sampling in qualitative research synthesis. Qualitative Research Journal, 11(2), 63-75. https://doi.org/10.3316/QRJ1102063
- Coyne, I. T. (1997). Sampling in qualitative research: purposeful and theoretical sampling. Journal of Advanced Nursing, 26(3), 623-630. https://doi.org/10.1046/j.1365-2648.1997.t01-25-00999.x
- Glaser, B. G., & Strauss, A. L. (1967). The Discovery of Grounded Theory. Aldine. https://doi.org/10.4324/9780203793206
- Lincoln, Y. S., & Guba, E. G. (1985). Naturalistic Inquiry. SAGE. https://doi.org/10.1016/0147-1767(85)90062-8
- Flyvbjerg, B. (2006). Five misunderstandings about case study research. Qualitative Inquiry, 12(2), 219-245. https://doi.org/10.1177/1077800405284363
- Sandelowski, M. (1995). Sample size in qualitative research. Research in Nursing and Health, 18(2), 179-183. https://doi.org/10.1002/nur.4770180211
- Vasileiou, K., et al. (2018). Characterising and justifying sample size sufficiency in interview based studies. BMC Medical Research Methodology, 18, 148. https://doi.org/10.1186/s12874-018-0594-7
- Creswell, J. W., & Poth, C. N. (2018). Qualitative Inquiry and Research Design (4th ed.). SAGE. Publisher page
- Miles, M. B., Huberman, A. M., & Saldana, J. (2020). Qualitative Data Analysis: A Methods Sourcebook (4th ed.). SAGE. Publisher page
- Braun, V., & Clarke, V. (2021). To saturate or not to saturate? Questioning data saturation as a useful concept for thematic analysis. Qualitative Research in Sport, Exercise and Health, 13(2), 201-216. https://doi.org/10.1080/2159676X.2019.1704846
- Baker, R., et al. (2013). Summary report of the AAPOR task force on non probability sampling. Journal of Survey Statistics and Methodology, 1(2), 90-143. https://doi.org/10.1093/jssam/smt008
- Tong, A., Sainsbury, P., & Craig, J. (2007). Consolidated criteria for reporting qualitative research (COREQ). International Journal for Quality in Health Care, 19(6), 349-357. https://doi.org/10.1093/intqhc/mzm042