

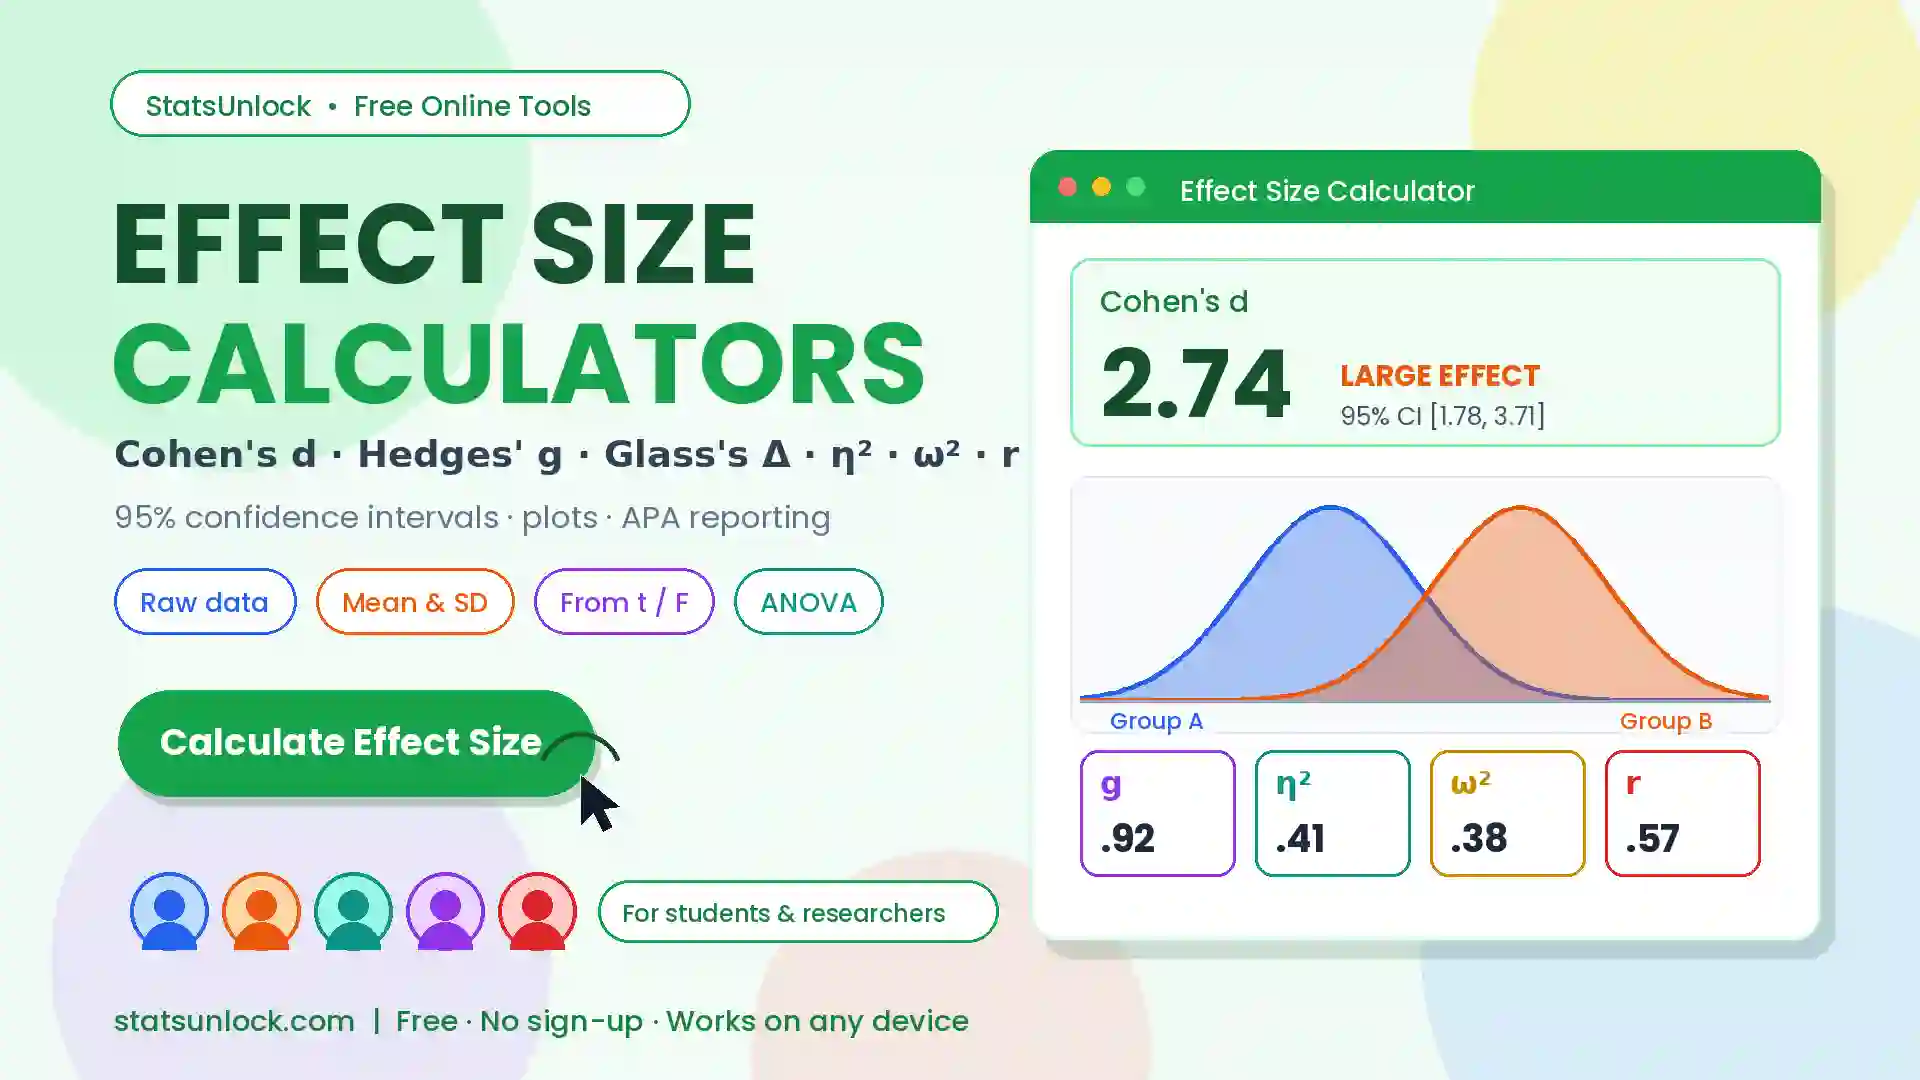

Effect Size Calculators: Cohen's d, Hedges' g, Glass's Δ, Eta Squared & r
Free effect size calculators for every common design. Paste raw data, enter means and standard deviations, or convert from a t or F value — and get Cohen's d with its confidence interval, Hedges' g, Glass's delta, the correlation r, eta squared, omega squared, distribution overlap, four colorful plots, and ready-to-copy APA sentences.
Quick answer: Effect size tells you how big a difference is, not just whether it exists. The most common is Cohen's d = (M₁ − M₂) ÷ pooled SD. Interpret it with Cohen's benchmarks: 0.2 = small, 0.5 = medium, 0.8 = large. For correlations r: 0.1 / 0.3 / 0.5. For eta squared (η²): 0.01 / 0.06 / 0.14. Always report the effect size alongside the p-value.
🔑 Key Takeaways
- 1Effect size answers "how big?", the p-value only answers "is it there?" With a large enough sample, a meaningless difference becomes statistically significant — effect size is immune to that.
- 2Cohen's d = mean difference ÷ pooled SD. It is expressed in standard deviation units, so d = 0.5 means the groups differ by half a standard deviation.
- 3Memorize the benchmarks: d = 0.2 small · 0.5 medium · 0.8 large. But treat them as fallbacks — field-specific norms beat Cohen's generic rules of thumb.
- 4Use Hedges' g for small samples. Cohen's d is biased upward when n is small; g applies a correction factor and is the safer default under about 20 per group.
- 5Report the confidence interval, not just the point estimate. "d = 0.45, 95% CI [0.02, 0.88]" is honest; a bare "d = 0.45" hides how uncertain the estimate is.
- 6Effect sizes convert into each other. d ↔ r ↔ η² are all related, and you can recover d from a published t value: d = t √(1/n₁ + 1/n₂).
- 7APA style requires effect sizes. Journals expect the test statistic, p-value, and effect size with CI together — reporting p alone is now considered incomplete.
📥 Choose Your Calculator
Convert a published t statistic into Cohen's d — useful for meta-analysis and re-reading papers that omitted the effect size.
Compute eta squared and omega squared from an ANOVA F test.
🛠 How to Use These Effect Size Calculators
- Choose your input. Raw Data if you have the observations, Mean & SD if you only have summary statistics, From t value to convert a published result, ANOVA for η² and ω², or upload a CSV.
- Enter the data. Paste comma-separated values (e.g., 52, 48, 55, 61, 47) for each group, or load one of the ten sample datasets covering small, medium, and large effects.
- Click "Calculate Effect Size." You get Cohen's d, Hedges' g, Glass's Δ, the correlation r, the 95% CI, distribution overlap, and the common-language effect size.
- Read the magnitude. Compare to Cohen's benchmarks (0.2 / 0.5 / 0.8), then check whether the confidence interval is narrow enough to be useful.
- Report it. Copy an APA-style sentence from the reporting section — effect size plus CI, immediately after the test statistic.
📑 Effect Size Benchmarks Table: Small, Medium & Large
These are Cohen's (1988) conventional benchmarks — the numbers everyone looks up. Use them when your field has no established norms, but remember Cohen himself called them a last resort.
| Effect size measure | Used for | Small | Medium | Large |
|---|---|---|---|---|
| Cohen's d / Hedges' g | Difference between two means | 0.20 | 0.50 | 0.80 |
| Pearson r | Correlation between two variables | 0.10 | 0.30 | 0.50 |
| r² / R² | Variance explained in regression | 0.01 | 0.09 | 0.25 |
| Eta squared (η²) | ANOVA — variance explained | 0.01 | 0.06 | 0.14 |
| Omega squared (ω²) | ANOVA — less biased η² | 0.01 | 0.06 | 0.14 |
| Cohen's f | ANOVA / power analysis | 0.10 | 0.25 | 0.40 |
| Odds ratio (OR) | Binary outcomes | 1.5 | 2.5 | 4.3 |
| Cramér's V (df = 1) | Chi-square / categorical | 0.10 | 0.30 | 0.50 |
Reading across a row tells you what counts as a meaningful effect in that metric. Reading down the "Medium" column shows how the same underlying effect looks in different units: d = 0.5 corresponds to roughly r = 0.24 and η² = 0.06.
ƒ Effect Size Formulas Used
🔍 Effect Size Interpretation — In Detail
An effect size is a standardized answer to "how much?". Cohen's d of 1.0 means the two group means sit a full standard deviation apart; d of 0.2 means they barely separate. Because the metric is unitless, it lets you compare a reaction-time study to a blood-pressure trial, and it is what meta-analyses pool across studies.
Step 1 — Magnitude against benchmarks
Start with Cohen's conventions (0.2 / 0.5 / 0.8 for d), but hold them loosely. Cohen introduced them reluctantly, for fields with no prior data, and modern reviews show typical effects differ wildly by discipline — median d is roughly 0.4 in social psychology, far smaller in medicine and genetics. A d of 0.3 might be trivial in a lab experiment and enormous in a public-health intervention reaching millions. Whenever your field has published distributions of effect sizes, benchmark against those instead.
Step 2 — Precision via the confidence interval
The point estimate is only half the story. "d = 0.45, 95% CI [0.02, 0.88]" tells you the effect is probably real but could be trivial or large — the study is underpowered. "d = 0.45, 95% CI [0.38, 0.52]" is a precise, trustworthy estimate. If the CI includes zero, the difference is not significant at α = .05, and this calculator flags that. Wide intervals are the visible symptom of small samples, which is why effect size and sample size planning belong together.
Step 3 — Translate into something human
Standard deviation units mean little to non-statisticians, so this tool also reports two plain-language translations. Distribution overlap is the percentage of the two distributions that coincide — a d of 0.8 still leaves about 69% overlap, which surprises most people and usefully deflates over-claiming. The common language effect size (probability of superiority) states the chance that a randomly chosen person from group 1 scores higher than a randomly chosen person from group 2: d = 0.5 corresponds to about 64%. These framings communicate far better than "half a standard deviation" in an abstract or a press release.
Choosing the right measure
Use Cohen's d for two independent means with similar variances and decent samples; Hedges' g when either group has fewer than about 20 observations; Glass's Δ when the intervention plausibly changed the variability, so only the control SD is a fair yardstick; r for continuous associations and for combining with correlational literature; and η² or ω² for ANOVA designs, preferring ω² because η² overestimates variance explained in small samples. Also note the sign: d is negative when group 2 has the larger mean, which simply reverses the direction — report the absolute magnitude plus a clear statement of which group scored higher.
✍ How to Report Effect Size in APA Style
APA 7 requires an effect size with every reported test. Place it immediately after the test statistic and p-value, with its confidence interval. Below are copy-ready templates — replace the bracketed values with your output.
Template 1 — Independent-samples t test (Cohen's d)
Template 2 — Small sample (Hedges' g)
Template 3 — ANOVA (eta squared / omega squared)
Template 4 — Non-significant result
Template 5 — Plain-language translation
Reporting checklist
Name the effect size measure explicitly (d, g, Δ, η²); give it to two decimals; include the confidence interval in square brackets; state which group was higher so the sign is unambiguous; justify the benchmark you used for "small/medium/large"; and never report a p-value without an accompanying effect size.
🔬 Example Results
Six worked examples using the built-in sample datasets. Load any of them from the dropdown above and click Calculate to reproduce the numbers exactly.
Example 1 — Large Effect: Treatment vs Control (d = 2.74)
sp = 0.971 · d = 2.74 · g = 2.67 · r = 0.81
95% CI [1.78, 3.71] · overlap 17%
A textbook large effect — more than three times Cohen's 0.8 threshold. The CI is far from zero, so the effect is unambiguous. Note the overlap is still 17%: even huge effects do not fully separate groups.
Example 2 — Medium Effect: Teaching Method A vs B (d = 0.52)
d = 0.52 · g = 0.51 · r = 0.25
95% CI [−0.11, 1.14] · overlap ~80%
Right at Cohen's "medium" threshold — but the confidence interval crosses zero, so with n = 20 per group this study cannot confirm the effect. A classic underpowered result: promising point estimate, uninformative interval.
Example 3 — Small Effect: Drug vs Placebo (d = 0.23)
d = 0.23 · g = 0.23 · r = 0.12
overlap ~91%
A small effect by Cohen's rule. Whether it matters depends entirely on context — a 0.23 effect on mortality in a cheap, safe drug given to millions is hugely valuable; the same effect on a lab task is negligible.
Example 4 — Converting a Published t Value into d
d = 7.76 × √(1/16 + 1/16) = 7.76 × 0.3536
d = 2.74
Many older papers report only t and p. This conversion recovers the effect size exactly — the same 2.74 obtained from the raw data in Example 1, confirming the two routes agree.
Example 5 — ANOVA: Eta Squared vs Omega Squared
η² = (5.20×2) ÷ (5.20×2 + 27) = 0.278
ω² = 2(5.20−1) ÷ (2(5.20−1) + 30) = 0.219
Both exceed the 0.14 "large" benchmark, but η² is noticeably higher because it is biased upward in small samples. With N = 30, reporting ω² = .22 is the more honest choice.
Example 6 — All Benchmarks Compared Side by Side
d = 0.5 → 80% overlap · 64% superiority
d = 0.8 → 69% overlap · 71% superiority
The single most useful calibration picture in statistics. Cohen's "large" effect still leaves roughly two-thirds of the distributions overlapping — a powerful antidote to overstating findings in abstracts and press releases.
🧭 When to Use These Calculators
Use these effect size calculators whenever you report a t test, ANOVA, or correlation and need the effect size APA requires; when you are planning a study and need an effect size estimate to feed into a power analysis; when conducting a meta-analysis and must convert published t or F values into a common metric; when comparing findings across studies that used different measurement scales; when a reviewer asks "is this difference practically meaningful?"; or when teaching the difference between statistical and practical significance. They fit researchers, graduate students, meta-analysts, and anyone reading or writing quantitative papers.
⚠ Assumptions & Limitations
Cohen's d and Hedges' g assume the two groups are independent and roughly normal with similar variances — the pooled SD is only a fair yardstick under homogeneity of variance. When variances differ markedly, prefer Glass's Δ or a robust alternative. These formulas are for independent samples; paired or repeated-measures designs need dz or dav, which use the SD of the differences and are not interchangeable with the values here. Effect sizes are highly unstable in small samples: with n = 10 per group the confidence interval spans roughly ±0.9, so treat small-study point estimates as rough. Outliers inflate or deflate d through the SD, so screen your data first (our skewness and kurtosis tools help). The CI here uses the standard normal approximation, which is excellent for moderate n but slightly narrow for very small samples where non-central t methods are exact. Finally, benchmarks are conventions, not laws — practical importance depends on cost, risk, and context, and no calculator can supply that judgement.
🏁 Conclusion
Effect size is the answer to the question a p-value cannot address: how big is it? Statistical significance tells you an effect is unlikely to be pure noise; effect size tells you whether it is worth caring about. That distinction is why APA style, most journals, and every meta-analysis now demand effect sizes as standard reporting, and why "p < .05" alone is no longer an acceptable result.
The mechanics are simple. For two groups, divide the mean difference by the pooled standard deviation to get Cohen's d, apply the small-sample correction for Hedges' g, and read the magnitude against 0.2 / 0.5 / 0.8 — while remembering those are conventions of last resort, not natural constants. For ANOVA, use η² or, better in small samples, ω². For associations, use r. Everything converts: d ties to r, and any published t value can be turned back into d for meta-analysis.
Two habits separate good reporting from careless reporting. First, always accompany the point estimate with its confidence interval — a wide interval is a study confessing its own imprecision. Second, translate the number into human terms: distribution overlap and probability of superiority communicate far better than standard deviation units, and they keep claims proportionate (a "large" d = 0.8 still leaves about 69% of the distributions overlapping). This tool gives you all of it — d, g, Δ, r, η², ω², intervals, plots, and APA sentences — so you can report not just whether an effect exists, but how much it actually matters.
❓ Frequently Asked Questions
What is effect size in simple terms?
How do you calculate Cohen's d?
What is a small, medium, and large effect size?
What is the difference between Cohen's d and Hedges' g?
When should I use Glass's delta?
How do I calculate effect size from a t value?
How do I convert Cohen's d to r?
Why report effect size instead of just p-values?
Can effect size be negative?
Can Cohen's d be greater than 1?
What is eta squared and how is it different from partial eta squared?
Why is omega squared preferred over eta squared?
What is the common language effect size?
What does distribution overlap tell me?
Do I need a confidence interval for the effect size?
What effect size should I use for a paired t test?
What effect size do I use for chi-square tests?
How do I use effect size for power analysis?
Are Cohen's benchmarks always appropriate?
Which effect size should I report in my paper?
📚 References
- Cohen, J. (1988). Statistical Power Analysis for the Behavioral Sciences (2nd ed.). Lawrence Erlbaum. https://doi.org/10.4324/9780203771587
- Cohen, J. (1992). A power primer. Psychological Bulletin, 112(1), 155–159. https://doi.org/10.1037/0033-2909.112.1.155
- Hedges, L. V. (1981). Distribution theory for Glass's estimator of effect size and related estimators. Journal of Educational Statistics, 6(2), 107–128. https://doi.org/10.3102/10769986006002107
- Hedges, L. V., & Olkin, I. (1985). Statistical Methods for Meta-Analysis. Academic Press. https://doi.org/10.1016/C2009-0-03396-0
- Glass, G. V. (1976). Primary, secondary, and meta-analysis of research. Educational Researcher, 5(10), 3–8. https://doi.org/10.3102/0013189X005010003
- Lakens, D. (2013). Calculating and reporting effect sizes to facilitate cumulative science: A practical primer for t-tests and ANOVAs. Frontiers in Psychology, 4, 863. https://doi.org/10.3389/fpsyg.2013.00863
- Cumming, G. (2014). The new statistics: Why and how. Psychological Science, 25(1), 7–29. https://doi.org/10.1177/0956797613504966
- Fritz, C. O., Morris, P. E., & Richler, J. J. (2012). Effect size estimates: Current use, calculations, and interpretation. Journal of Experimental Psychology: General, 141(1), 2–18. https://doi.org/10.1037/a0024338
- Kelley, K., & Preacher, K. J. (2012). On effect size. Psychological Methods, 17(2), 137–152. https://doi.org/10.1037/a0028086
- McGraw, K. O., & Wong, S. P. (1992). A common language effect size statistic. Psychological Bulletin, 111(2), 361–365. https://doi.org/10.1037/0033-2909.111.2.361
- Olejnik, S., & Algina, J. (2003). Generalized eta and omega squared statistics: Measures of effect size for some common research designs. Psychological Methods, 8(4), 434–447. https://doi.org/10.1037/1082-989X.8.4.434
- Funder, D. C., & Ozer, D. J. (2019). Evaluating effect size in psychological research: Sense and nonsense. Advances in Methods and Practices in Psychological Science, 2(2), 156–168. https://doi.org/10.1177/2515245919847202
- Lakens, D. (2022). Sample size justification. Collabra: Psychology, 8(1), 33267. https://doi.org/10.1525/collabra.33267
- Sullivan, G. M., & Feinn, R. (2012). Using effect size — or why the P value is not enough. Journal of Graduate Medical Education, 4(3), 279–282. https://doi.org/10.4300/JGME-D-12-00156.1
- Nakagawa, S., & Cuthill, I. C. (2007). Effect size, confidence interval and statistical significance: A practical guide for biologists. Biological Reviews, 82(4), 591–605. https://doi.org/10.1111/j.1469-185X.2007.00027.x
- Ellis, P. D. (2010). The Essential Guide to Effect Sizes. Cambridge University Press. https://doi.org/10.1017/CBO9780511761676
- Wilkinson, L., & Task Force on Statistical Inference. (1999). Statistical methods in psychology journals: Guidelines and explanations. American Psychologist, 54(8), 594–604. https://doi.org/10.1037/0003-066X.54.8.594
- American Psychological Association. (2020). Publication Manual of the American Psychological Association (7th ed.). apastyle.apa.org
- Grissom, R. J., & Kim, J. J. (2012). Effect Sizes for Research: Univariate and Multivariate Applications (2nd ed.). Routledge. https://doi.org/10.4324/9780203803233
- Borenstein, M., Hedges, L. V., Higgins, J. P. T., & Rothstein, H. R. (2009). Introduction to Meta-Analysis. Wiley. https://doi.org/10.1002/9780470743386