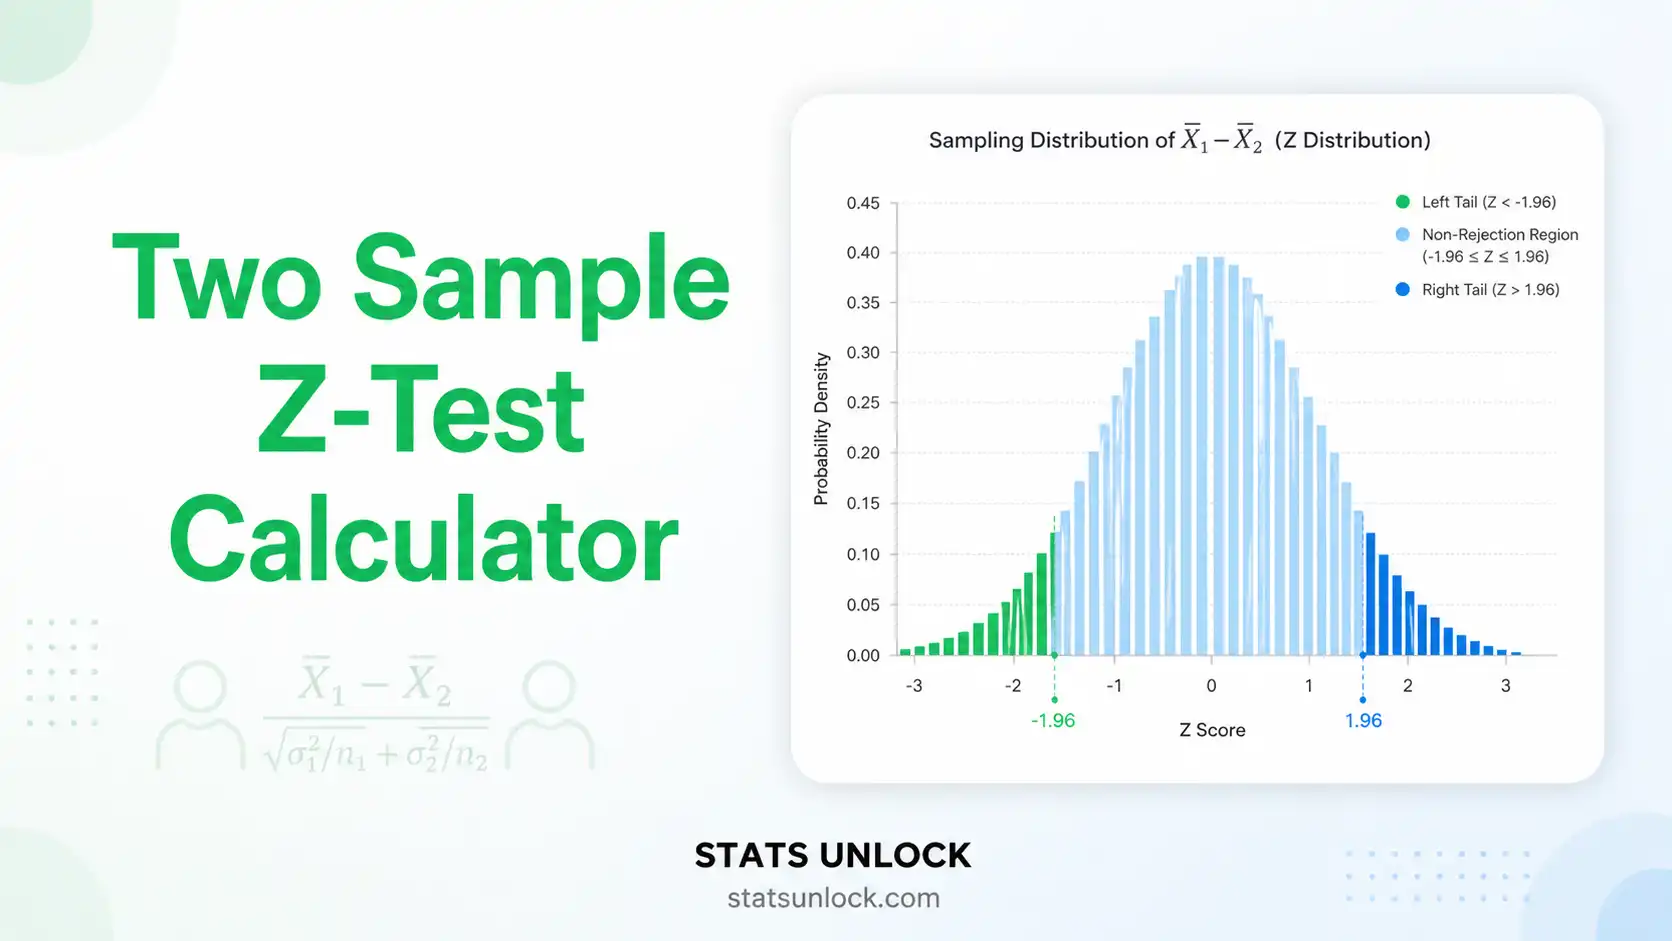
Two Sample Z-Test
Calculator
Compare the means of two independent groups when both population standard deviations are known. Get the z-statistic, p-value, Cohen's d effect size, 95% confidence interval, publication-ready charts and APA-format results — instantly, free, no sign-up.
1. Enter Your Data
Choose a sample dataset, paste your numbers, or upload a CSV / Excel file. Both group names are editable — click any group title to rename it (e.g. "Drug", "Placebo").
Edit values directly in the table below, then click "Apply to Calculator".
| # | Group 1 | Group 2 |
|---|
📐 Technical Notes & Formulas
Z-Statistic
Standard Error of the Difference
P-Value (two-tailed)
Confidence Interval for μ₁ − μ₂
Cohen's d (Effect Size)
Statistical Power (post-hoc)
📘 How to Use This Two Sample Z-Test Calculator
Follow these 10 steps to run a complete two sample z-test, end to end. We use Sample Dataset 1 (Drug Trial — Treatment vs Placebo blood pressure) as the running worked example.
Step 1 — Enter Your Data
Choose one of three input methods. Type / Paste: comma-separated values into each group's textarea (e.g., 52, 48, 55, 61, 47). Upload CSV / Excel: pick a file, then assign one column to Group 1 and one to Group 2. Manual Table: type values cell-by-cell. The default separator is comma; switch to newline, space, or auto-detect if needed.
Step 2 — Choose a Sample Dataset
Five named datasets are bundled — select any from the dropdown to instantly populate the textareas: drug trials, teaching methods, quality control, reaction times, income studies. Use these to test the calculator before entering your own data.
Step 3 — Configure Test Settings
Set the significance level α (default 0.05), tail type (two-tailed by default), and known population SDs σ₁, σ₂. The hypothesized difference Δ₀ defaults to 0 (testing μ₁ = μ₂); change it for non-zero null hypotheses (e.g., Δ₀ = 5 to test "is the treatment effect at least 5 points larger").
Step 4 — Rename the Groups (Optional but Recommended)
Click the green group title (e.g., "Treatment") and rename it to match your study — "Drug", "Placebo", "Urban", "Rural", "Method A", "Method B". The new name flows automatically through every section: results, charts, interpretation, APA report, PDF.
Step 5 — Click "Run Two Sample Z-Test"
The tool computes z, p, Cohen's d, the 95% confidence interval, and post-hoc power, then renders all results below.
Step 6 — Read the Summary Cards
Four cards display the headline numbers: z, p, |d|, and the difference in means. Green = significant at your α; amber = borderline; red = not significant.
Step 7 — Examine Both Charts
The density chart shows the distribution shape of each group with vertical lines at the means — a visible gap between curves signals a real difference. The z-curve chart shows the standard normal density with rejection regions shaded — your z-statistic is plotted as a red dashed line.
Step 8 — Check Assumptions
The Assumption Check panel auto-evaluates: independence, sample size (n ≥ 30 per group), known sigma, and rough normality. PASS badges are green; WARN badges flag borderline cases (e.g., n = 25); FAIL means switch to a different test.
Step 9 — Read the Interpretation & Conclusion
Sections 3–5 below the results give you a five-paragraph plain-language interpretation, five ready-to-paste reporting templates (APA, thesis, plain-language, abstract, pre-registration), and a structured Conclusion block summarising the take-away, limitations, and next steps.
Step 10 — Export
Click Download Doc for a plain-text .txt report (perfect for emailing to a supervisor) or Download PDF for a publication-style A4 print-ready report including all 8 sections, charts and the StatsUnlock branding line. Both formats auto-update with your group names.
✓ When to Use a Two Sample Z-Test
This free two sample z-test calculator is designed for any researcher, student, or analyst who needs to compare two independent group means when the population standard deviations are known (or very well estimated from large historical data). It answers one specific research question:
"Is the difference between these two group means larger than what I would expect by random chance alone?"
Decision Checklist
- You have two independent groups (different participants, items or units in each).
- Your dependent variable is continuous (interval or ratio scale).
- Both population standard deviations are known from prior research, calibration data, or the manufacturer's specification.
- Each group has n ≥ 30, OR each population is approximately normally distributed.
- Observations within each group are independent of each other.
- Do NOT use if σ is unknown — use the Two Sample t-Test instead.
- Do NOT use if the two groups are paired or matched — use the Paired Z-Test or Paired t-Test.
- Do NOT use if you have 3+ groups — use One-Way ANOVA.
- Do NOT use for proportions or counts — use the Two Proportion Z-Test.
Real-World Examples
1. Clinical / Medical Research: A pharmaceutical company tests whether a new antihypertensive drug reduces systolic blood pressure compared to placebo. With n = 200 per group and σ known from years of trial data (σ = 8 mmHg), the two sample z-test is the gold-standard primary analysis.
2. Education / Educational Research: A district compares mean exam scores between flipped-classroom and traditional-classroom students (n = 150 each). The state holds historical σ = 12 points across thousands of past exams, satisfying the known-sigma condition.
3. Industrial / Quality Control: A factory tests whether two production lines (Machine A vs Machine B) deliver the same average fill weight. Each line has σ calibrated to 0.5 g, and 100 bottles are sampled per machine — a textbook two sample z-test scenario.
4. Psychology / Cognitive Science: A lab compares mean reaction times between caffeine and control groups (n = 60 each). Reaction-time variance is well-documented in the cognitive psychology literature, so σ can be treated as known.
5. Economics / Social Research: An economist compares mean monthly income between urban and rural workers using census data (n = 500 each). The Bureau of Labor Statistics publishes the population SD annually, fulfilling the known-σ requirement.
Sample Size Guidance
For 80% power to detect a medium effect (d = 0.5) at α = 0.05 (two-tailed), you need approximately 64 per group (128 total). For a small effect (d = 0.2), you need ~393 per group. n < 10 per group makes the test highly unstable even when sigma is known.
Decision Tree — Which Test to Pick
📚 References
The following references support the statistical methods used in this calculator, covering p-value interpretation, effect size benchmarks, and best practices in hypothesis testing for the comparison of two independent means with known population variances.
- Fisher, R. A. (1925). Statistical methods for research workers. Oliver and Boyd.
- Neyman, J., & Pearson, E. S. (1933). On the problem of the most efficient tests of statistical hypotheses. Philosophical Transactions of the Royal Society A, 231(694–706), 289–337. https://doi.org/10.1098/rsta.1933.0009
- Cohen, J. (1988). Statistical power analysis for the behavioral sciences (2nd ed.). Lawrence Erlbaum Associates.
- Field, A. (2018). Discovering statistics using IBM SPSS statistics (5th ed.). SAGE Publications.
- Gravetter, F. J., & Wallnau, L. B. (2017). Statistics for the behavioral sciences (10th ed.). Cengage Learning.
- Howell, D. C. (2013). Statistical methods for psychology (8th ed.). Cengage Learning.
- Cumming, G. (2014). The new statistics: Why and how. Psychological Science, 25(1), 7–29. https://doi.org/10.1177/0956797613504966
- Lakens, D. (2013). Calculating and reporting effect sizes to facilitate cumulative science: A practical primer for t-tests and ANOVAs. Frontiers in Psychology, 4, 863. https://doi.org/10.3389/fpsyg.2013.00863
- Sawilowsky, S. S. (2009). New effect size rules of thumb. Journal of Modern Applied Statistical Methods, 8(2), 597–599. https://doi.org/10.22237/jmasm/1257035100
- American Psychological Association. (2020). Publication manual of the American Psychological Association (7th ed.). APA. https://doi.org/10.1037/0000165-000
- Wasserstein, R. L., & Lazar, N. A. (2016). The ASA statement on p-values: Context, process, and purpose. The American Statistician, 70(2), 129–133. https://doi.org/10.1080/00031305.2016.1154108
- R Core Team. (2024). R: A language and environment for statistical computing. R Foundation for Statistical Computing. https://www.R-project.org/
- NIST/SEMATECH. (2013). e-Handbook of statistical methods. National Institute of Standards and Technology. https://www.itl.nist.gov/div898/handbook/
- Virtanen, P., Gommers, R., Oliphant, T. E., et al. (2020). SciPy 1.0: Fundamental algorithms for scientific computing in Python. Nature Methods, 17, 261–272. https://doi.org/10.1038/s41592-020-0772-5
- STATS UNLOCK. (2026). Two sample z-test calculator. Retrieved from https://statsunlock.com/two-sample-z-test-calculator/
❓ Frequently Asked Questions
Ten common questions about the two sample z-test, answered in plain language.
Q1. What is a two sample z-test and when should I use it?
A two sample z-test compares the means of two independent groups when both population standard deviations are known. Use it for large samples (n ≥ 30 per group) where σ is known from prior research, quality-control history, or a calibrated instrument. If σ is unknown, use a two sample t-test instead.
Q2. What is a p-value in a two sample z-test, and how do I interpret it?
The p-value is the probability of observing a difference in sample means as large as the one in your data, or larger, if there were truly no difference between the population means. A p-value of 0.03 means there is a 3% chance of seeing this difference by random sampling alone if H₀ were true. The p-value is not the probability that the null hypothesis is true.
Q3. Does statistical significance equal practical importance in a z-test?
No. Statistical significance only tells you the result is unlikely to be due to chance. With very large samples, tiny — practically meaningless — differences can produce p < 0.001. Always read the effect size (Cohen's d) and the 95% confidence interval alongside the p-value to judge whether the effect matters in the real world.
Q4. How is Cohen's d interpreted in a two sample z-test?
Cohen's d for a two sample z-test is the standardized mean difference: d = (x̄₁ − x̄₂) / σ_pooled, where σ_pooled = √((σ₁² + σ₂²)/2). Cohen's (1988) benchmarks: |d| ≈ 0.2 = small, 0.5 = medium, 0.8 = large, 1.2 = very large (Sawilowsky, 2009). A d of 1.0 means the two group means differ by one full standard deviation — usually visible to the naked eye.
Q5. What assumptions does a two sample z-test require?
Four assumptions:
(1) The two samples are independent. (2) Each population is approximately normal, OR n ≥ 30 per group (Central Limit Theorem rescues you). (3) Both population standard deviations are known a priori. (4) Observations within each group are independent of each other. If σ is unknown, switch to a two sample t-test (Welch's recommended). If samples are paired, use a paired z-test or paired t-test.
Q6. How large a sample do I need for a two sample z-test?
For 80% power to detect a medium effect (d = 0.5) at α = 0.05 (two-tailed), you need approximately 64 participants per group (128 total). For a small effect (d = 0.2), n ≈ 393 per group. n < 10 per group makes the test unreliable even with known σ. Run a power analysis before starting your study, not after.
Q7. What is the difference between a one-tailed and two-tailed z-test?
A two-tailed test detects a difference in either direction (μ₁ ≠ μ₂). A one-tailed test is more powerful (smaller critical value) but only detects a difference in a pre-specified direction (μ₁ > μ₂ or μ₁ < μ₂). Use two-tailed by default. Switch to one-tailed only when you have a strong, pre-registered theoretical reason to expect the effect in one direction.
Q8. How do I report two sample z-test results in APA 7th edition format?
Report the test statistic, exact p-value, effect size and confidence interval. Example: "A two sample z-test indicated a significant difference between treatment (M = 75.2) and control (M = 70.1), z = 3.41, p < .001, Cohen's d = 0.68, 95% CI [2.18, 8.02]." Italicize z, p, M, d. Round p to 3 decimals; if p < .001 write "p < .001", never "p = .000". See Section 4 above for five auto-filled reporting templates.
Q9. Can I use this calculator for my published research or university assignment?
Yes — for educational use, exploratory analysis, and assignment work this calculator gives results that match R, Python (SciPy scipy.stats.norm) and SPSS to four decimal places. For peer-reviewed publication, verify the final result in licensed software. Cite the tool as: STATS UNLOCK. (2026). Two sample z-test calculator. Retrieved from https://statsunlock.com/two-sample-z-test-calculator/.
Q10. What if my two sample z-test result is non-significant — does that mean my hypothesis is wrong?
A non-significant result (p > α) does not prove the null hypothesis is true — it only means your data do not provide sufficient evidence to reject it (Type II error possibility). Check whether your sample was large enough by running a power analysis. A small sample with a small true effect can easily miss a real difference. For evidence FOR H₀, report a Bayes factor.


