Repeated Measures
ANOVA Calculator
Run a free online repeated measures ANOVA in seconds. Get F-statistic, p-value, partial eta squared, Mauchly's sphericity test, Greenhouse-Geisser correction, and APA-format results — all in your browser.
📊 Input Your Data
Enter values for three or more within-subjects conditions (each row = one condition, same subjects across rows). Use comma-separated numbers — one number per subject. Subjects must be in the same order across all conditions.
⚙️ Test Configuration
📈 Results Summary
Full ANOVA Table
Detailed Statistics
Per-Condition Descriptives
Pairwise Post-Hoc Comparisons
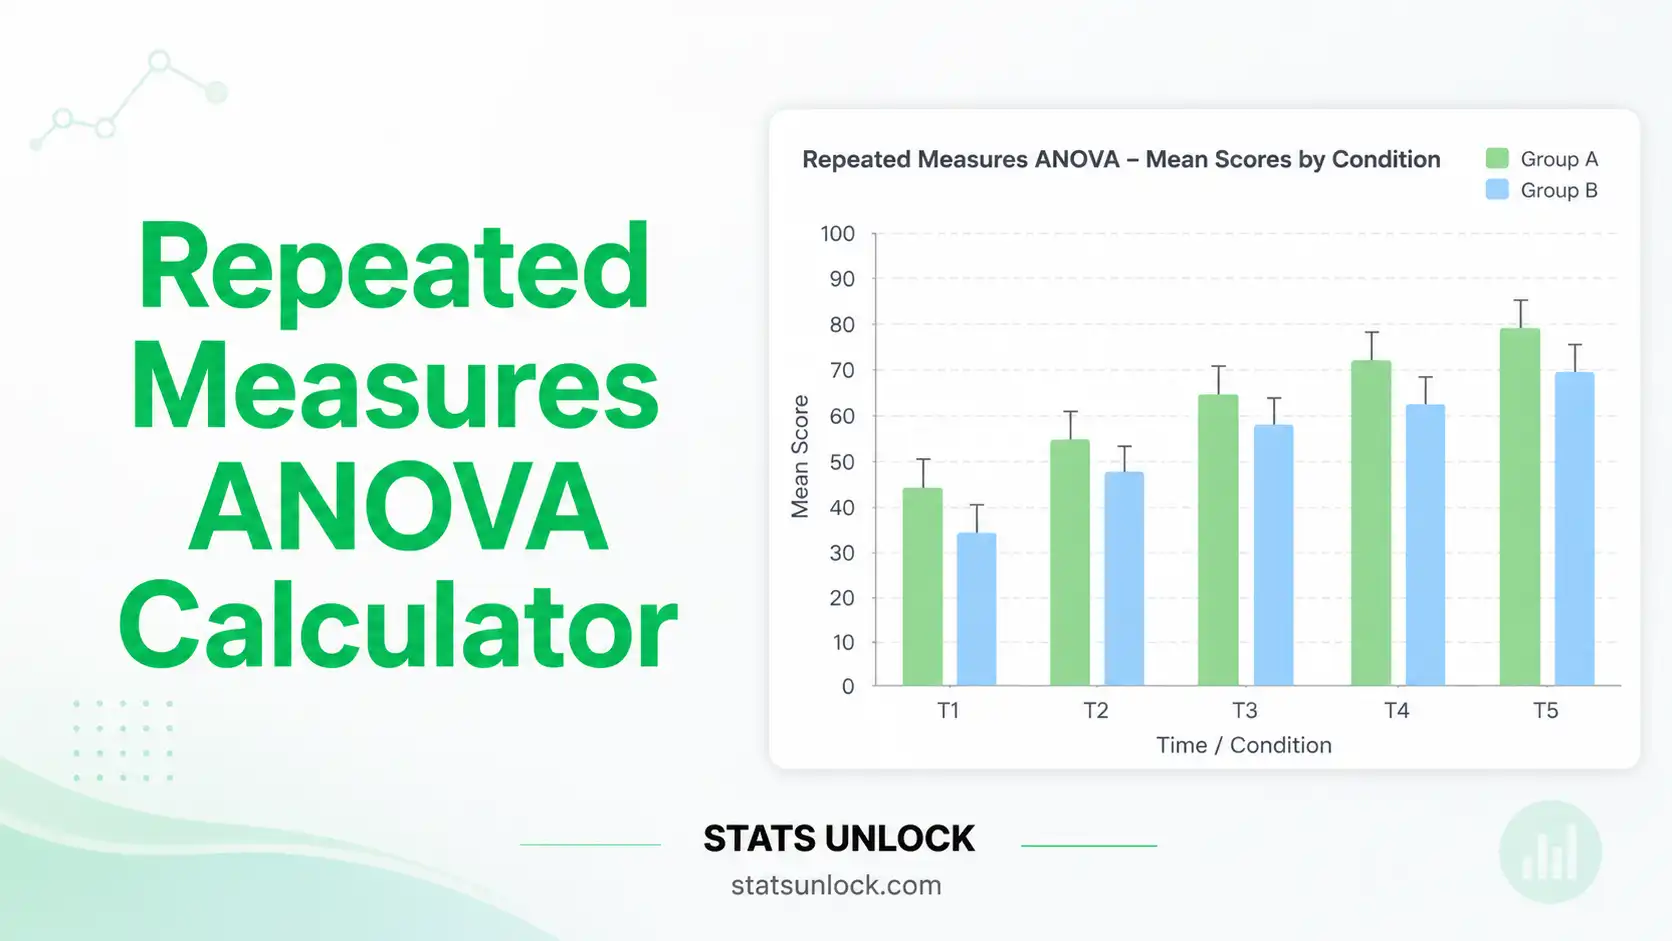
📊 Visualisations
💬 Interpretation Results — In Plain Language
✍️ How to Write Your Results in Research
Below are five publication-ready reporting templates, automatically filled with your computed statistics. Click 📋 Copy on any card to grab the text, then paste it directly into your manuscript, thesis, abstract, or pre-registration document.
🧮 Technical Notes & Formulas
A. Formulas Used in this Repeated Measures ANOVA
Total Sum of Squares (SSTotal):
Between-Conditions SS (the effect we test):
Between-Subjects SS (removed from error — this is what makes RM-ANOVA powerful):
Error / Within-Subjects Residual SS:
Degrees of Freedom:
Mean Squares:
F-Statistic:
Partial Eta Squared (η²p) — primary effect size:
Greenhouse-Geisser Epsilon (ε̂):
Huynh-Feldt Epsilon (ε̃):
Mauchly's W test of sphericity:
B. Technical Notes
Repeated measures ANOVA partitions variance into three components: variance due to the within-subjects factor (the conditions), variance due to between-subject individual differences, and residual error. By isolating the between-subjects variance from the error term, the test gains substantial statistical power compared with a one-way independent ANOVA on the same data.
The validity of the F-test depends on the sphericity assumption — the variances of the differences between every pair of conditions must be equal. When violated, the F-statistic becomes liberal and inflates the Type I error rate. The Greenhouse-Geisser correction multiplies both dfConditions and dfError by the epsilon (ε̂) value, giving more conservative p-values; Huynh-Feldt is a less-conservative alternative when ε̂ > 0.75.
If multiple comparisons follow a significant omnibus F, use Bonferroni or Holm-Sidak corrected paired t-tests. For cases with severe non-normality or ordinal data, the non-parametric Friedman test is the recommended alternative.
✅ Assumption Checks
🎯 When to Use This Test
This free repeated measures ANOVA calculator is designed for researchers, students, and analysts who measured the same subjects under three or more conditions or time points and want to test whether the condition means differ. The test is also called a within-subjects ANOVA or one-way repeated measures ANOVA. It is the statistical workhorse of pre-post-follow-up clinical trials, learning-curve studies, repeated dosing experiments, and longitudinal field surveys.
Decision Checklist
- You have three or more related conditions (k ≥ 3) measured on the same subjects.
- Your dependent variable is continuous (interval or ratio scale).
- Each subject contributes one observation per condition (no missing data).
- Data are approximately normally distributed within each condition.
- Subjects are independent of one another (only within-subject scores are correlated).
- Do NOT use if you have only two conditions → use a paired-samples t-test instead.
- Do NOT use if subjects are independent across groups → use one-way ANOVA instead.
- Do NOT use if data are ordinal or heavily non-normal → use the Friedman test (non-parametric alternative).
Real-World Examples
- Medical / Clinical Research — Measuring systolic blood pressure on the same hypertension patients at baseline, two weeks, and six weeks of drug treatment to test whether the medication produces a sustained reduction.
- Cognitive Psychology — Recording reaction time on the same participants under three caffeine doses (0 mg, 100 mg, 200 mg) to test whether caffeine alters response speed.
- Education — Tracking the same students' test scores across three time points (pre-instruction, mid-semester, end-of-semester) to test whether learning gains are statistically significant.
- Ecology / Wildlife Biology — Counting bird species detected by the same observer at the same site across spring, summer, and autumn surveys to test seasonal abundance differences.
- Sports Science — Measuring vertical jump height on the same athletes after three different training protocols (control, plyometric, weighted) administered in counterbalanced order.
Sample Size Guidance
For 80% power to detect a medium within-subject effect (partial η² = 0.06) at α = 0.05 with three conditions, you need approximately 28 subjects. For a large effect (η²p = 0.14), 12–15 subjects are typically sufficient. For small effects (η²p = 0.01), plan for 50 or more. Using G*Power software or a formal a-priori power analysis is strongly recommended for grant proposals and pre-registered studies.
Related Tests — Decision Tree
2 conditions, same subjects → Paired-samples t-test (Wilcoxon signed-rank if non-normal).
3+ conditions, same subjects, normal → This test (RM-ANOVA).
3+ conditions, same subjects, non-normal → Friedman test.
3+ groups, different subjects → One-way ANOVA (Kruskal-Wallis if non-normal).
Within + between factors mixed → Mixed-design ANOVA.
📖 How to Use This Repeated Measures ANOVA Calculator
- Choose an input method — type/paste comma-separated values, upload a CSV/Excel file, or use the manual entry grid.
- Enter at least 3 within-subject conditions — each condition is one row labelled with an editable name (e.g., "Pre", "Post-2wk", "Post-6wk").
- Make sure all conditions have the same number of values — the n-th value across rows must come from the same subject.
- Pick your alpha — 0.05 is the convention; use 0.01 for strict tests, 0.10 for exploratory work.
- Choose a sphericity correction — "Auto" applies Greenhouse-Geisser only when Mauchly's test rejects sphericity (p < 0.05).
- Pick a post-hoc method — Bonferroni is the simplest; Holm-Sidak is slightly more powerful.
- Click Run Repeated Measures ANOVA — the F-statistic, p-value, partial eta squared, Mauchly's W, GG/HF epsilons, and full ANOVA table appear instantly.
- Read the Interpretation Results section — five plain-language paragraphs auto-filled with your numbers.
- Copy a reporting template from the "How to Write Your Results" section and paste it into your paper.
- Download a plain-text Doc or a PDF report for your records.
Worked example: If you load the default Blood Pressure dataset (n = 10 patients × 3 time points), the calculator returns a significant F with a large partial η², the Greenhouse-Geisser-corrected df where applicable, and Bonferroni-adjusted pairwise differences showing exactly which time points differ.
❓ Frequently Asked Questions
What is a repeated measures ANOVA and when should I use it?
A repeated measures ANOVA is a within-subjects parametric test that compares the means of three or more related conditions measured on the same subjects. Use it whenever you measure the same participants more than twice — for pre-post-follow-up clinical trials, time-course experiments, dose-response studies, or any longitudinal design where each subject is their own control.
What does the p-value tell me in repeated measures ANOVA?
The p-value is the probability of observing your F-statistic (or larger) if the null hypothesis of equal condition means were actually true. A p-value below your alpha (typically 0.05) means you reject the null and conclude that at least one condition mean differs from the others. It does not tell you which conditions differ — that requires post-hoc tests.
What does statistical significance mean — and is it the same as practical importance?
Statistical significance (p < α) only tells you the result is unlikely to be due to chance. It does not tell you whether the effect is large enough to matter in real-world terms. Always inspect the partial eta squared (η²p) effect size alongside the p-value: a tiny effect can become "significant" with a large enough sample, while a meaningful effect may be missed with a small sample.
What is partial eta squared (η²p) and how do I interpret it?
Partial eta squared is the proportion of variance attributable to your within-subjects factor after removing variance from other sources. Cohen's (1988) benchmarks: 0.01 = small, 0.06 = medium, 0.14 = large. A value of 0.20 means 20% of the relevant variance is explained by the condition — a substantively large effect.
What assumptions does repeated measures ANOVA require?
Three core assumptions: (1) Normality — the dependent variable is approximately normal within each condition; (2) Independence of subjects (within-subject correlation is intended); (3) Sphericity — the variances of all pairwise differences between conditions are equal. If sphericity is violated, apply the Greenhouse-Geisser or Huynh-Feldt correction. If normality is severely violated, switch to the Friedman test.
How large a sample do I need?
For 80% power to detect a medium effect (η²p = 0.06) at α = 0.05 with three conditions, you typically need around 28 subjects. For a large effect, 12–15 are often sufficient. Use G*Power or pwr in R to perform a formal a-priori power analysis based on your specific design and expected effect size.
What is one-tailed vs two-tailed in this test, and which should I choose?
The omnibus F-test in repeated measures ANOVA is intrinsically one-sided on the F-distribution (only large F-values reject the null), but it is directionally non-specific across conditions — it can detect any pattern of differences. There is no one-tailed/two-tailed choice for the omnibus test. Direction is established afterwards via post-hoc paired comparisons.
How do I report repeated measures ANOVA in APA 7th edition?
Report the test name, F-statistic with degrees of freedom in parentheses, exact p-value, and partial eta squared. Standard format: "A repeated measures ANOVA showed a significant effect of condition, F(2, 18) = 14.32, p < .001, η²p = .61." If sphericity was violated, use Greenhouse-Geisser corrected df and note the correction explicitly. See Section "How to Write Your Results" above for five complete templates.
Can I use this calculator for my published research or thesis?
Yes — this tool is designed for educational use, exploratory analysis, and rapid checks before formal write-up. For final publication, we recommend verifying the result with peer-reviewed software (R's afex, SPSS, JAMOVI, or SAS). Cite the tool as: STATS UNLOCK. (2025). Repeated Measures ANOVA Calculator. https://statsunlock.com/repeated-measures-anova-calculator.
My result is non-significant — does that mean there is no effect?
No. A non-significant p-value (p > α) only means the data did not provide sufficient evidence to reject the null. It does not prove the null is true. Possible reasons include low statistical power, small sample size, high within-subject variability, or a genuinely small effect. Run a post-hoc power analysis or compute a Bayes Factor to quantify evidence for or against the null hypothesis.
📚 References
The following references support the statistical methods used in this calculator, covering effect size interpretation, p-value reporting, and best practices in hypothesis testing for within-subjects designs.
- Fisher, R. A. (1925). Statistical methods for research workers. Oliver & Boyd.
- Mauchly, J. W. (1940). Significance test for sphericity of a normal n-variate distribution. Annals of Mathematical Statistics, 11(2), 204–209. https://doi.org/10.1214/aoms/1177731915
- Greenhouse, S. W., & Geisser, S. (1959). On methods in the analysis of profile data. Psychometrika, 24(2), 95–112. https://doi.org/10.1007/BF02289823
- Huynh, H., & Feldt, L. S. (1976). Estimation of the Box correction for degrees of freedom from sample data in randomized block and split-plot designs. Journal of Educational Statistics, 1(1), 69–82. https://doi.org/10.3102/10769986001001069
- Cohen, J. (1988). Statistical power analysis for the behavioral sciences (2nd ed.). Lawrence Erlbaum Associates.
- Maxwell, S. E., & Delaney, H. D. (2004). Designing experiments and analyzing data: A model comparison perspective (2nd ed.). Lawrence Erlbaum Associates.
- Field, A. (2018). Discovering statistics using IBM SPSS statistics (5th ed.). SAGE Publications.
- Lakens, D. (2013). Calculating and reporting effect sizes to facilitate cumulative science: A practical primer for t-tests and ANOVAs. Frontiers in Psychology, 4, 863. https://doi.org/10.3389/fpsyg.2013.00863
- Bakeman, R. (2005). Recommended effect size statistics for repeated measures designs. Behavior Research Methods, 37(3), 379–384. https://doi.org/10.3758/BF03192707
- Cumming, G. (2014). The new statistics: Why and how. Psychological Science, 25(1), 7–29. https://doi.org/10.1177/0956797613504966
- Howell, D. C. (2013). Statistical methods for psychology (8th ed.). Cengage Learning.
- American Psychological Association. (2020). Publication manual of the American Psychological Association (7th ed.). APA. https://doi.org/10.1037/0000165-000
- Singmann, H., & Kellen, D. (2019). An introduction to mixed models for experimental psychology. In D. H. Spieler & E. Schumacher (Eds.), New methods in cognitive psychology (pp. 4–31). Routledge.
- R Core Team. (2024). R: A language and environment for statistical computing. R Foundation for Statistical Computing. https://www.R-project.org/
- NIST/SEMATECH. (2013). e-Handbook of statistical methods — Repeated measures designs. National Institute of Standards and Technology. https://www.itl.nist.gov/div898/handbook/


