Mean Absolute Deviation Calculator (MAD) — Free Online Tool | StatsUnlock

Mean Absolute Deviation Calculator (MAD) — Free Online Tool | StatsUnlock

Mean Absolute Deviation Calculator

Calculate MAD from mean or median instantly — with step-by-step breakdown, charts, APA report, and CSV/Excel export.

📐 Descriptive Statistics 📊 Measure of Dispersion 🔢 Free Online Tool 📁 CSV Upload 📄 APA Export

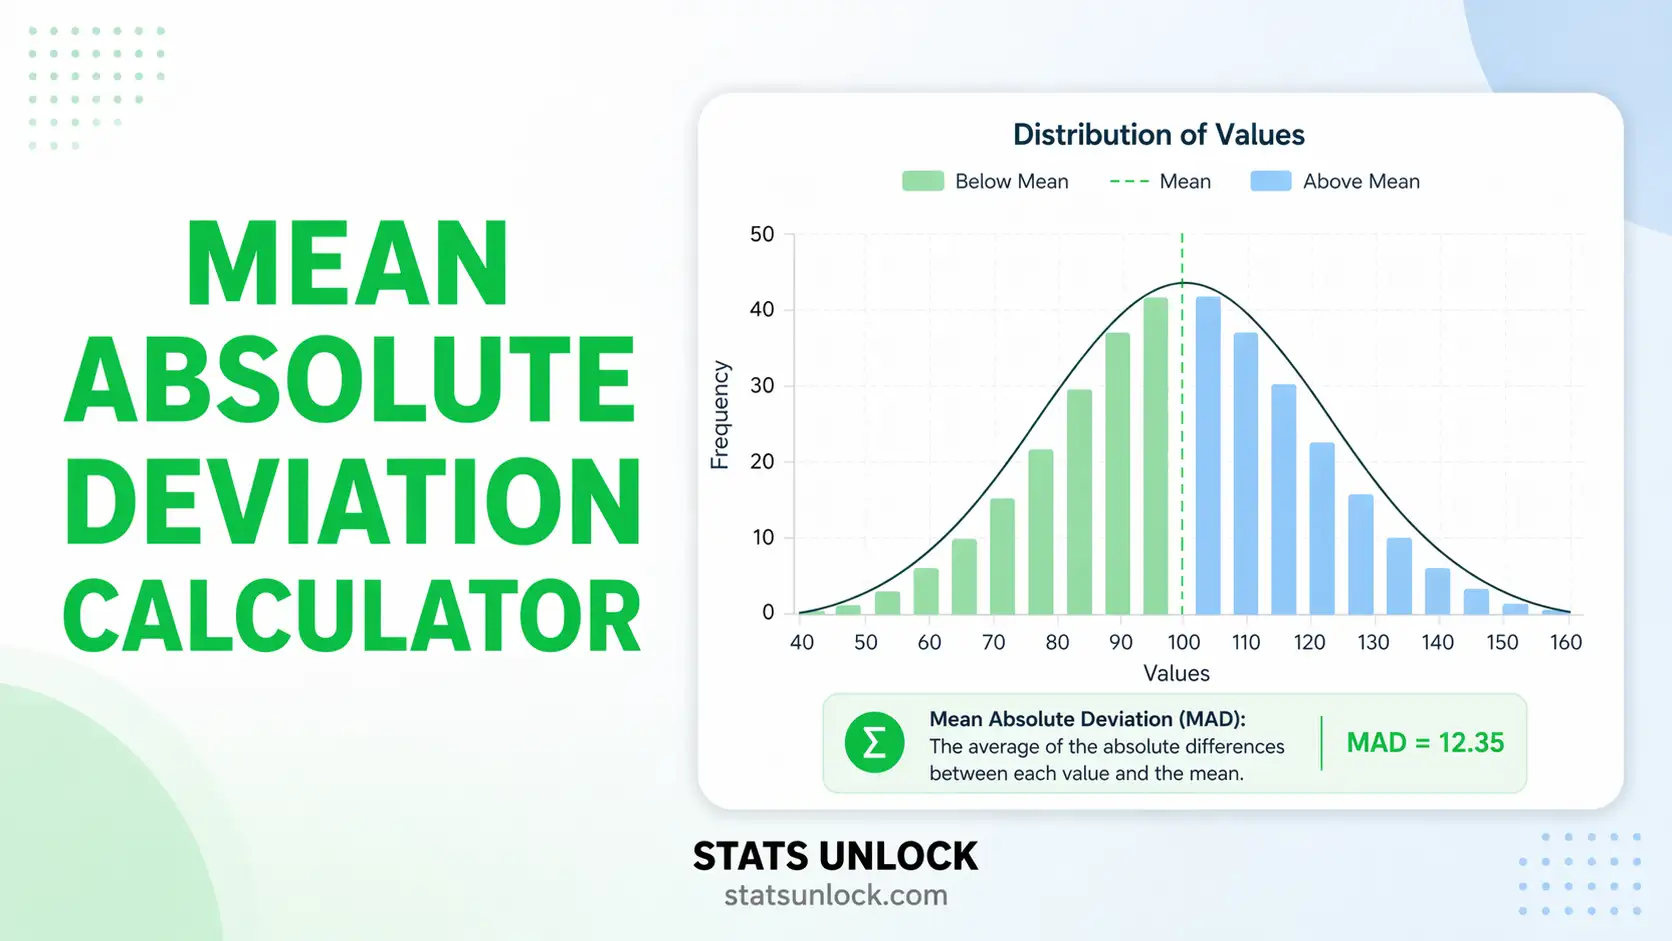
What Is Mean Absolute Deviation (MAD)?

The mean absolute deviation (MAD) is a robust measure of dispersion in descriptive statistics. It quantifies the average distance of each data point from the mean (or median), using absolute differences so positive and negative deviations do not cancel out. Unlike standard deviation, MAD does not square the deviations, making it less sensitive to outliers — an ideal choice for skewed or non-normal data.

MAD = (1/n) × Σ |xᵢ − x̄|

For median absolute deviation, replace x̄ with the median: MAD = median(|xᵢ − median(x)|).

1. Enter Your Data

Enter at least 2 values. Commas, spaces, or newlines accepted.
Supports .csv, .txt, .xlsx, .xls — headers detected automatically.
Value

2. Configure Settings

Results

StatisticValueDescription

Visualizations

Distribution with MAD Bands
Absolute Deviations per Observation
📋 Assumption Checks

Download Results

How to Write Your Results

Choose the reporting style that matches your context. All values are auto-filled from your analysis.

Interpretation

🔬 Technical Notes & Formulas

Mean Absolute Deviation Formulas

MAD from Mean:
MAD = (1/n) × Σ |xᵢ − x̄|
Where x̄ = arithmetic mean, xᵢ = each value, n = count
Median Absolute Deviation:
MAD = median(|xᵢ − median(x)|)
More robust to outliers; uses median as centre
Coefficient of Dispersion (CD):
CD = MAD / mean × 100%
Relative measure, allows comparison across datasets

MAD relates to standard deviation (σ) approximately as: MAD ≈ 0.7979 × σ for normally distributed data, meaning σ ≈ 1.2533 × MAD.

When to Use Mean Absolute Deviation

✅ Use MAD When:

  • Your data contains outliers
  • The distribution is skewed or non-normal
  • You need an easy-to-interpret dispersion metric
  • Comparing variability across different datasets
  • Teaching or communicating statistics to non-experts
  • Working with financial returns or ecological counts

⚠️ Consider SD Instead When:

  • Data is approximately normally distributed
  • Feeding into parametric tests (t-test, ANOVA)
  • Calculating confidence intervals
  • Maximum likelihood estimation required
  • Consistent with journal reporting norms

🌳 Quick Decision Tree

Does your data have outliers or strong skew?
 → Yes → Use MAD (or Median MAD for maximum robustness)
 → No → Use Standard Deviation (normal parametric context)

Are you comparing spread across different units/scales?
 → Yes → Use Coefficient of Variation (MAD/mean)
 → No → MAD in original units is sufficient

How to Use This Calculator — 10 Steps

1
Choose your input method — paste numbers directly, upload a CSV/Excel file, or enter values manually in the table.
2
For CSV/Excel upload — select the sheet (Excel only) and click a column button to pick the numeric column you want to analyse.
3
Or use a sample dataset — the dropdown preloads 5 real-world example datasets so you can explore the tool immediately.
4
Select the centre type — "Mean MAD" is the standard formula; "Median MAD" is more robust when your data has outliers.
5
Set significance level — α = 0.05 gives 95% confidence intervals; adjust to 0.01 or 0.10 as needed.
6
Click "Calculate MAD" — the tool computes MAD, SD, IQR, CV, skewness, kurtosis, and confidence intervals instantly.
7
Review the stat cards — key values (MAD, n, mean, SD) shown prominently at the top of the results.
8
Inspect the charts — the distribution chart shows MAD bands around the mean; the deviation chart shows each observation's absolute deviation.
9
Copy reporting templates — use APA 7th, thesis, or plain-language templates with auto-filled values for your paper or report.
10
Download your results — export as .txt Doc, .xlsx Excel, rich .docx Word report, or a print-ready PDF with all sections.
Worked Example: Dataset: 4, 7, 13, 16 → Mean = 10 → Deviations: |4−10|=6, |7−10|=3, |13−10|=3, |16−10|=6 → MAD = (6+3+3+6)/4 = 4.5

Frequently Asked Questions

What is mean absolute deviation (MAD)?
The mean absolute deviation (MAD) is the average of the absolute differences between each data point and the dataset's mean (or median). It is a robust measure of variability in descriptive statistics that stays in the original units of the data, making it easy to interpret without transformation.
How do you calculate mean absolute deviation step by step?
1. Calculate the mean of your data. 2. For each value, subtract the mean and take the absolute value: |xᵢ − x̄|. 3. Sum all absolute deviations. 4. Divide by n (the number of values). The result is MAD = (1/n) × Σ|xᵢ − x̄|.
What is the difference between MAD and standard deviation?
MAD uses absolute differences while standard deviation uses squared differences. This means MAD penalizes outliers less — it is more robust. Standard deviation is preferred when data is normal and for use in parametric tests. MAD is preferred for skewed or outlier-prone data and for easy communication.
What is median absolute deviation and when should I use it?
Median absolute deviation replaces the mean with the median as the reference point: MAD = median(|xᵢ − median(x)|). Use it when your data is heavily skewed or has extreme outliers. It is even more robust than mean-based MAD and is widely used in anomaly detection and robust statistics.
Can MAD be negative?
No. MAD is always zero or positive. Because it uses absolute values, all deviations are non-negative. A MAD of exactly zero means every value in your dataset is identical (no variability at all).
When should I use MAD instead of standard deviation?
Use MAD when: (1) your data contains significant outliers, (2) the distribution is skewed or non-normal, (3) you are communicating results to a non-technical audience, or (4) you need an easily interpretable spread metric. For parametric inference (t-tests, ANOVA, regression), standard deviation is generally preferred.
How is MAD used in finance and economics?
In finance, MAD measures portfolio volatility as an alternative to standard deviation. It is preferred when return distributions have fat tails (non-normal), because MAD does not disproportionately penalize extreme losses. It is also used in mean-absolute-deviation portfolio optimization as a linear programming alternative to mean-variance optimization.
What is a good or acceptable MAD value?
There is no universal benchmark for MAD — it depends entirely on the scale and context of your data. A MAD of 5 is "small" for incomes in the thousands but "large" for temperature readings in a controlled lab. To contextualize MAD, compute the coefficient of dispersion: CD = MAD/mean × 100%. Values below 10–15% generally indicate low variability.
How does MAD relate to standard deviation for normal data?
For perfectly normally distributed data, MAD ≈ 0.7979 × σ (standard deviation), or equivalently σ ≈ 1.2533 × MAD. This relationship allows you to estimate standard deviation from MAD when working with robust statistics. The relationship weakens for non-normal distributions.
Can this calculator handle large datasets?
Yes. You can type, paste, or upload datasets of any size. For large datasets, use the CSV/Excel upload tab — the tool automatically extracts numeric columns and supports both .csv and .xlsx files. All computations run in your browser with no server-side processing, keeping your data private.

References

The following references support the mean absolute deviation calculator, its MAD formula, and related descriptive statistics methods described in this tool.

  1. Gorard, S. (2005). Revisiting a 90-year-old debate: The advantages of the mean deviation. British Journal of Educational Studies, 53(4), 417–430. https://doi.org/10.1111/j.1467-8527.2005.00304.x
  2. Huber, P. J., & Ronchetti, E. M. (2009). Robust Statistics (2nd ed.). John Wiley & Sons. https://doi.org/10.1002/9780470434697
  3. Rousseeuw, P. J., & Croux, C. (1993). Alternatives to the median absolute deviation. Journal of the American Statistical Association, 88(424), 1273–1283. https://doi.org/10.2307/2291267
  4. Field, A. (2018). Discovering Statistics Using IBM SPSS Statistics (5th ed.). SAGE Publications.
  5. Leys, C., Ley, C., Klein, O., Bernard, P., & Licata, L. (2013). Detecting outliers: Do not use standard deviation around the mean, use absolute deviation around the median. Journal of Experimental Social Psychology, 49(4), 764–766. https://doi.org/10.1016/j.jesp.2013.03.013
  6. Conover, W. J. (1999). Practical Nonparametric Statistics (3rd ed.). John Wiley & Sons.
  7. Wilcox, R. R. (2012). Introduction to Robust Estimation and Hypothesis Testing (3rd ed.). Academic Press. https://doi.org/10.1016/C2010-0-67044-1
  8. Ruppert, D. (2004). Statistics and finance: An introduction. In Springer Texts in Statistics. Springer.
  9. Montgomery, D. C., Peck, E. A., & Vining, G. G. (2021). Introduction to Linear Regression Analysis (6th ed.). John Wiley & Sons.
  10. American Psychological Association. (2020). Publication Manual of the American Psychological Association (7th ed.). APA Publishing. https://doi.org/10.1037/0000165-000
  11. Cohen, J. (1988). Statistical Power Analysis for the Behavioral Sciences (2nd ed.). Lawrence Erlbaum Associates.
  12. Gould, W., Pitblado, J., & Poi, B. (2010). Maximum Likelihood Estimation with Stata (4th ed.). Stata Press.

Leave a Reply

Your email address will not be published. Required fields are marked *

Previous Post
Next Post

© 2026 STATS UNLOCK . statsunlock.com –  All Rights Reserved.