▶ Run the analysis above to auto-fill all five examples with your results.
✅ Assumption & Data Quality Checks
🔢 Technical Notes & Formulas
Formulas Used
Q1 = 25th percentile of sorted data
Q3 = 75th percentile of sorted data
IQR = Q3 − Q1
Tukey Lower Fence = Q1 − k × IQR
Tukey Upper Fence = Q3 + k × IQR
where k = 1.5 (mild outliers) or 3 (extreme)
Median = middle value (odd n) or mean of two middle values (even n)
Mean = Σxᵢ / n
Variance (sample) = Σ(xᵢ − x̄)² / (n − 1)
SD = √variance
SEM = SD / √n
CV = (SD / |x̄|) × 100%
Skewness = [n/((n−1)(n−2))] × Σ((xᵢ−x̄)/s)³
Kurtosis (excess) = [n(n+1)/((n−1)(n−2)(n−3))] × Σ((xᵢ−x̄)/s)⁴ − 3(n−1)²/((n−2)(n−3))
CI for Median (bootstrap approach):
CI ≈ Median ± z × (IQR / 1.35) / √n
where z = 1.96 (95%), 2.576 (99%), 1.645 (90%)
Quartile methods: Tukey/Hinge uses the inclusive median split; Inclusive (QUARTILE.INC) interpolates between data points; Exclusive (QUARTILE.EXC) uses outer quartiles. Results can differ slightly for small datasets.
📖 How to Use This IQR Calculator (10 Steps)
1
Enter your data — type numbers separated by commas, spaces, or new lines in the "Type Data" tab. Or upload a CSV/Excel file using the Upload tab.
2
Select a sample dataset from the dropdown to explore how the tool works before using your own data.
3
Choose a quartile method — Tukey/Hinge is the statistical default. Use Inclusive for Excel-compatible results.
4
Set the fence multiplier — 1.5 × IQR is the standard for detecting mild outliers; 3 × IQR flags only extreme outliers.
5
Click "Calculate IQR" — the tool instantly computes Q1, Q3, IQR, median, mean, SD, and all other descriptive statistics.
6
Read the summary cards at the top of the results — IQR, Q1, Q3, and Median are highlighted here for a quick overview.
7
Inspect the box plot — the box spans Q1 to Q3 (IQR). The line inside is the median. Whiskers extend to the Tukey fences; points beyond are outliers.
8
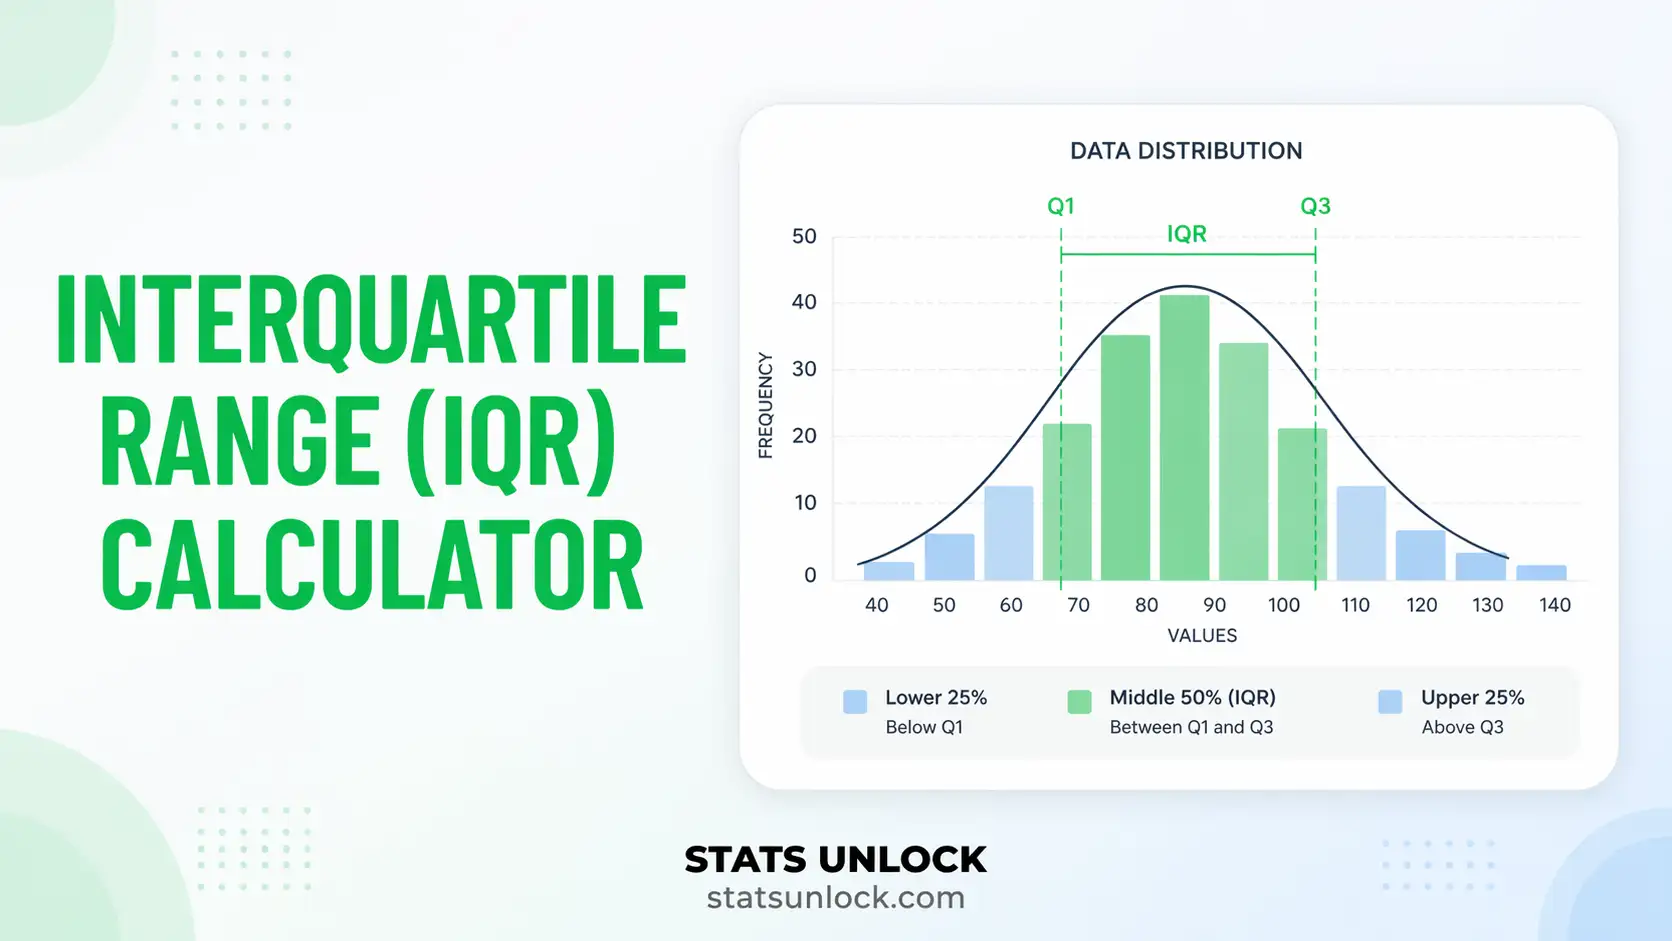
Check the histogram — the green shaded region marks the IQR (Q1 to Q3), showing where the central 50% of your data falls.
9
Review the full results table for all 20+ computed statistics, each with a plain-English description.
10
Download your results — export as a plain text Doc, Excel spreadsheet, Word report, or PDF using the four download buttons.
The interquartile range (IQR) is the recommended measure of spread whenever data are skewed, contain outliers, or are measured on an ordinal scale. It captures the spread of the central 50% of values and pairs naturally with the median.
✔ USE IQR when:
✔ Your data has outliers or extreme values
✔ The distribution is skewed (not bell-shaped)
✔ You are reporting alongside the median
✔ Data are ordinal or contain non-normal continuous values
✔ You are constructing box plots or Tukey fence outlier detection
✘ PREFER SD/Variance when:
✘ Data are approximately normally distributed
✘ You are reporting alongside the mean
✘ Downstream analyses assume normality (t-tests, ANOVA)
Real-World Examples:
🏥 Clinical research: Hospital stay durations are right-skewed — median ± IQR is standard in medical journals.
🦁 Wildlife ecology: Body weight data for animals often have outliers; IQR gives a robust spread estimate.
📈 Finance: Income and salary distributions are right-skewed — IQR avoids distortion from top earners.
📚 Education: Exam score distributions with floor/ceiling effects benefit from IQR-based reporting.
❓ Frequently Asked Questions
What is the interquartile range (IQR)?
The interquartile range (IQR) is the difference between the third quartile (Q3, the 75th percentile) and the first quartile (Q1, the 25th percentile). It represents the spread of the middle 50% of your data and is robust to outliers — making it ideal for skewed distributions.
What is the IQR formula in statistics?
The IQR formula is: IQR = Q3 − Q1. First sort your data, find Q1 (the median of the lower half) and Q3 (the median of the upper half), then subtract. This tool calculates it for you automatically using three different quartile methods.
How do you calculate IQR step by step?
Step 1: Sort your dataset in ascending order. Step 2: Find the median (Q2). Step 3: Find Q1 — the median of all values below Q2. Step 4: Find Q3 — the median of all values above Q2. Step 5: Calculate IQR = Q3 − Q1. For an even dataset, the lower half excludes the overall median.
How do you detect outliers using IQR?
Using Tukey fences: Lower fence = Q1 − 1.5 × IQR and Upper fence = Q3 + 1.5 × IQR. Any value below the lower fence or above the upper fence is a potential outlier. Values beyond 3 × IQR from Q1/Q3 are extreme outliers. This tool flags all outliers automatically.
What is the difference between IQR and standard deviation?
Standard deviation (SD) measures spread around the mean and is sensitive to outliers. IQR measures the spread of the central 50% of data and is robust to outliers. For symmetric, normal data, SD is preferred. For skewed distributions or datasets with outliers, IQR is the better measure of spread.
What does a large IQR indicate?
A large IQR means the middle 50% of your data is spread over a wide range — indicating high variability in the central portion of the distribution. A small IQR indicates that the data clusters tightly around the median. Compare IQR to the median for context: a large IQR relative to the median signals high relative variability.
Can the IQR ever be negative or zero?
The IQR cannot be negative because Q3 ≥ Q1 by definition. It can be zero if the 25th and 75th percentiles are equal — this happens when many values in the dataset are identical (e.g., all values in the middle 50% are the same).
What is the IQR in a box plot?
In a box plot, the IQR is the length of the rectangular box. The left edge of the box marks Q1 and the right edge marks Q3. The line inside the box is the median. Whiskers extend from the box to the Tukey fences, and individual points beyond the whiskers are outliers.
Which quartile method should I use?
For most statistical work, use the Tukey/Hinge method (the default in R and most statistics textbooks). If you need results compatible with Microsoft Excel, use QUARTILE.INC (Inclusive method). The differences are most noticeable with small datasets.
How is IQR used in descriptive statistics reports?
IQR is reported alongside the median in the format: Median [Q1, Q3] or Median (IQR). For example: "Response time was 14.5 ms (IQR = 8.2 ms)" or "Median = 14.5 ms [10.4, 18.6]". It is standard in medical, ecological, and social science journals when data are non-normal.
📚 References
The interquartile range calculator below draws on foundational descriptive statistics and robust outlier detection literature. Key references for IQR computation and Tukey fence methodology are listed below.
Tukey, J. W. (1977). Exploratory Data Analysis. Addison-Wesley.
Hyndman, R. J., & Fan, Y. (1996). Sample quantiles in statistical packages. The American Statistician, 50(4), 361–365. https://doi.org/10.2307/2684934
Rousseeuw, P. J., & Croux, C. (1993). Alternatives to the median absolute deviation. Journal of the American Statistical Association, 88(424), 1273–1283. https://doi.org/10.1080/01621459.1993.10476408
Hoaglin, D. C., Mosteller, F., & Tukey, J. W. (Eds.). (1983). Understanding Robust and Exploratory Data Analysis. Wiley.
Field, A. (2018). Discovering Statistics Using IBM SPSS Statistics (5th ed.). SAGE Publications.
Zwillinger, D., & Kokoska, S. (2000). CRC Standard Probability and Statistics Tables and Formulae. CRC Press.
R Core Team (2024). R: A language and environment for statistical computing. R Foundation. https://www.R-project.org/
Frigge, M., Hoaglin, D. C., & Iglewicz, B. (1989). Some implementations of the boxplot. The American Statistician, 43(1), 50–54. https://doi.org/10.2307/2685173
Barnett, V., & Lewis, T. (1994). Outliers in Statistical Data (3rd ed.). Wiley.
Wilcox, R. R. (2012). Introduction to Robust Estimation and Hypothesis Testing (3rd ed.). Academic Press.
McGill, R., Tukey, J. W., & Larsen, W. A. (1978). Variations of box plots. The American Statistician, 32(1), 12–16.
Agresti, A. (2018). Statistical Methods for the Social Sciences (5th ed.). Pearson.
IQR Calculator — Interquartile Range Report
Statistical Analysis Report
Generated by STATS UNLOCK — statsunlock.com
1. Test Overview
2. Input Data Summary
Statistic
Value
3. Full Statistical Results
Statistic
Value
Description
4. Interpretation
5. Reporting in APA Format
6. Assumption Checks
7. References
Tukey (1977); Hyndman & Fan (1996); Field (2018); Wilcox (2012) — see full reference list in tool.