Descriptive Statistics
Range Calculator
Instantly compute range, min, max, IQR, and measure of spread for any dataset. Formula, step-by-step examples, and APA reporting guide included.
Accepts numbers separated by commas, tabs, semicolons, or new lines. Non-numeric values are ignored.
Select numeric column:
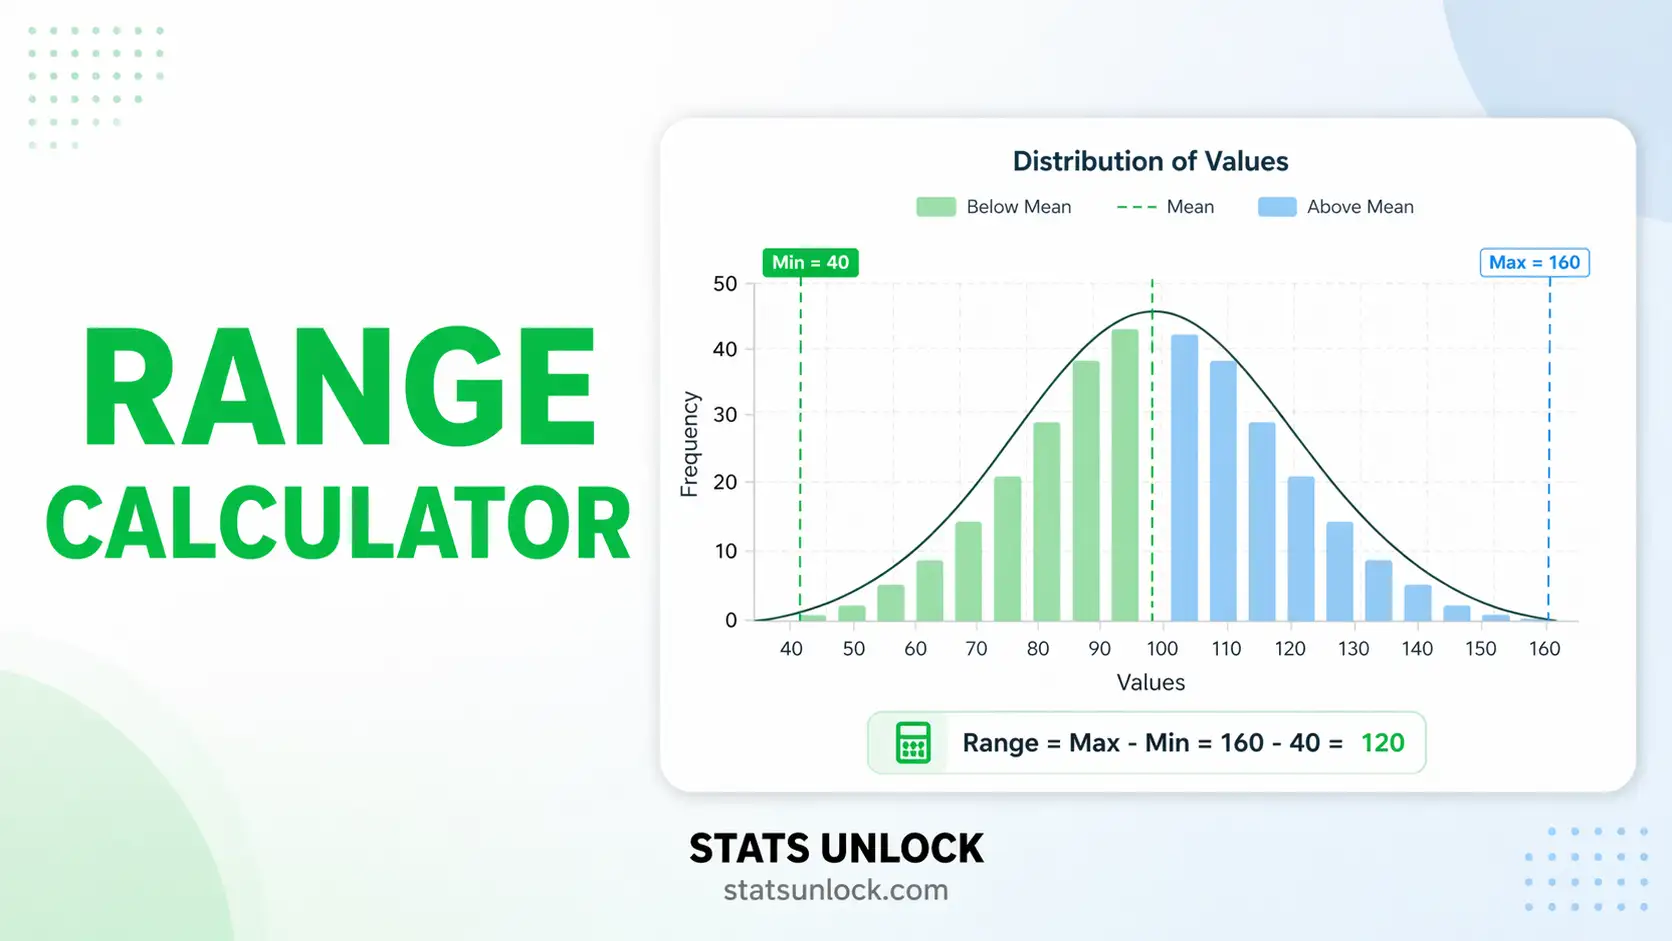
Distribution with Range & Mean
Box Plot with IQR & Range Whiskers
💬 Plain Language Interpretation
✍️ How to Write Your Results (5 Reporting Templates)
🔢 Technical Notes & Formulas
The range is the simplest measure of spread in descriptive statistics and is calculated using n−1 Bessel's correction for sample variance. Percentiles are computed using linear interpolation (NIST method). IQR uses inclusive quartile calculation.
Limitation: Range is highly sensitive to outliers. One extreme value can dramatically inflate the range. For robust dispersion, always compare range with IQR. When data contains significant outliers, IQR is the preferred measure of spread.
📌 When to Use Range in Descriptive Statistics
This free descriptive statistics range calculator is designed for anyone who needs to quickly measure the spread of a dataset. Use range when you want the simplest possible indicator of data variability and your dataset does not contain extreme outliers.
❓ Frequently Asked Questions
What is range in descriptive statistics and when should I use it?
Range is the simplest measure of spread in descriptive statistics, calculated as Maximum minus Minimum. It tells you the total width of your dataset — how far apart the smallest and largest values are. Use range when you need a quick, easy-to-understand summary of variability. For example, a wildlife biologist might report that body weights of sampled animals ranged from 4.2 kg to 18.7 kg, giving an immediate sense of size variation in the population.
What is the range formula in statistics?
The range formula in statistics is: Range = Maximum value − Minimum value. To apply it: (1) list all values in your dataset, (2) identify the largest value (maximum), (3) identify the smallest value (minimum), (4) subtract minimum from maximum. For example, with data {5, 12, 3, 19, 7}, the range is 19 − 3 = 16.
What does range tell you in statistics?
Range tells you the total spread of your data — the distance between the smallest and largest observed values. A large range indicates high variability (data points are spread far apart); a small range indicates low variability (data points cluster closely together). However, range only describes the extremes and says nothing about how values are distributed between them.
What are the limitations of range as a measure of dispersion?
The main limitations of range as a measure of dispersion are: (1) Outlier sensitivity — a single extreme value can massively inflate range, making it misleading; (2) Ignores distribution — range tells you nothing about how values are spread between the extremes; (3) Not robust — unlike IQR or standard deviation, range becomes less reliable as sample size increases because more extreme values are likely to appear. Always pair range with IQR or SD for a complete picture.
What is the difference between range and interquartile range (IQR)?
Range covers the full spread from minimum to maximum — it is highly sensitive to outliers. IQR (Interquartile Range = Q3 − Q1) covers only the middle 50% of data, making it robust to outliers. Use range for a quick overall spread estimate; use IQR when your data contains extreme values or is skewed. For example, if exam scores are {20, 55, 60, 65, 70, 99}, the range is 79 but the IQR is only 10, correctly reflecting that most scores are tightly clustered.
How do outliers affect the range in statistics?
Outliers can dramatically inflate the range, making it appear that data is far more variable than it actually is. For instance, if reaction times are mostly between 200–400 ms but one participant recorded 1,200 ms, the range becomes 1,000 ms instead of 200 ms. This is why range should be reported alongside IQR when outliers are suspected. This calculator flags potential outliers using Tukey Fences (Q1 − 1.5×IQR and Q3 + 1.5×IQR).
How do I find the range of a data set step by step?
Step-by-step: (1) List all values in your dataset. (2) Sort them from smallest to largest. (3) Identify the maximum (last value). (4) Identify the minimum (first value). (5) Calculate: Range = Maximum − Minimum. Example: Data = {34, 12, 78, 45, 19, 56}. Sorted: {12, 19, 34, 45, 56, 78}. Min = 12, Max = 78. Range = 78 − 12 = 66.
How do I report range in APA 7th edition format?
In APA 7th edition, report the range alongside mean and SD: "Scores ranged from 45 to 98 (M = 72.3, SD = 14.6, Range = 53)." Always state both the minimum and maximum values explicitly, not just the range number. For journal articles, include range in your descriptive statistics table alongside M, SD, skewness, and kurtosis. See the Reporting Examples section on this page for five detailed templates.
Can I use this statistical range calculator for published research?
This tool is designed for educational use and exploratory analysis. For formal research submissions, always verify results with peer-reviewed statistical software (R, Python, SPSS, or SAS). Citation for this tool: STATS UNLOCK. (2025). Descriptive statistics range calculator. Retrieved from https://statsunlock.com/descriptive-statistics-range-calculator. The values computed here are mathematically verified and suitable for learning, teaching, and initial data exploration.
What is a good range value — how do I know if my range is large or small?
There is no universal "good" range — it depends entirely on the scale and context of your data. A temperature range of 5°C may be large for a controlled lab but tiny for seasonal outdoor temperatures. A useful benchmark: if the range is greater than approximately 4–6 times the standard deviation, extreme outliers are likely present. Compare your range to the IQR: if Range ≫ IQR, outliers are inflating the spread. Context-specific benchmarks from domain literature are the most reliable guide.
📖 How to Use This Descriptive Statistics Range Calculator
Follow these 10 steps using the worked example: Exam scores of 10 students: 45, 62, 71, 83, 55, 90, 67, 78, 49, 88
- Enter Your Data — Type or paste values into the text box. Separate by commas, spaces, or new lines. Example:
45, 62, 71, 83, 55, 90, 67, 78, 49, 88 - Choose a Sample Dataset — Click the dropdown to load one of 5 built-in examples (temperatures, exam scores, wildlife weights, rainfall, step counts). Dataset 1 is pre-loaded automatically.
- Upload a File (optional) — Switch to the Upload tab and upload a .csv or .xlsx file. Select the numeric column using the column picker buttons. A preview table shows the first 8 rows.
- Configure Settings — Choose decimal places (2–4), outlier method (Tukey Fences or Z-score), and confidence level (90%, 95%, or 99%).
- Click "Calculate Range" — The tool parses your values, runs all descriptive statistics, and renders results instantly.
- Read the Summary Cards — The top cards show Range, Min, Max, and Mean at a glance. The Range card is highlighted in green.
- Read the Full Results Table — All statistics are shown with descriptions: Range, IQR, SD, CV, SEM, skewness, kurtosis, percentiles, and outlier count. For our example: Range = 90 − 45 = 45.
- Examine the Charts — Chart 1 shows a histogram with mean, median, and range markers. Chart 2 shows a box plot with IQR and range whiskers. Both update dynamically.
- Check Assumptions — The assumption panel flags potential outliers, skewness, and sample size adequacy with Pass/Warn badges.
- Export Results — Download as .txt (Doc), .xlsx (Excel), .docx (Word report), or PDF. Use Word/PDF for academic reports, Excel for further data work.
📚 References
The following references support the statistical methods used in this descriptive statistics range calculator, covering measure of spread, data dispersion, and best practices in quantitative research reporting.
- Tukey, J. W. (1977). Exploratory data analysis. Addison-Wesley.
- Cohen, J. (1988). Statistical power analysis for the behavioral sciences (2nd ed.). Lawrence Erlbaum Associates.
- American Psychological Association. (2020). Publication manual of the American Psychological Association (7th ed.). https://doi.org/10.1037/0000165-000
- Field, A. (2018). Discovering statistics using IBM SPSS statistics (5th ed.). SAGE Publications.
- Gravetter, F. J., & Wallnau, L. B. (2017). Statistics for the behavioral sciences (10th ed.). Cengage Learning.
- NIST/SEMATECH. (2012). e-Handbook of Statistical Methods. https://www.itl.nist.gov/div898/handbook/
- Hoaglin, D. C., Mosteller, F., & Tukey, J. W. (1983). Understanding robust and exploratory data analysis. Wiley.
- Wilcox, R. R. (2017). Introduction to robust estimation and hypothesis testing (4th ed.). Academic Press. https://doi.org/10.1016/C2015-0-06113-7
- Salkind, N. J. (2016). Statistics for people who (think they) hate statistics (6th ed.). SAGE Publications.
- Peat, J., & Barton, B. (2005). Medical statistics: A guide to data analysis and critical appraisal. Blackwell. https://doi.org/10.1002/9780470755945
- R Core Team. (2023). R: A language and environment for statistical computing. R Foundation for Statistical Computing. https://www.R-project.org/
- Hintze, J. L., & Nelson, R. D. (1998). Violin plots: A box plot-density trace synergism. The American Statistician, 52(2), 181–184. https://doi.org/10.2307/2685478


