Fisher's Exact Test Calculator
A free online Fisher's exact test calculator for 2×2 contingency tables. Compute the exact p-value, odds ratio, 95% confidence intervals, and a publication-ready APA report from your categorical data — perfect for small samples where chi-square is unreliable.
📊 Step 1 — Enter Your Data
Enter binary outcomes (1 = success/event, 0 = failure/no event) as comma-separated values for each group. Group names are fully editable.
Comma-separated. Each value must be 0 or 1.
Comma-separated. Each value must be 0 or 1.
Upload a CSV / Excel file. Two columns expected: Group (text) and Outcome (0 or 1). Or two numeric columns (one per group) of 0/1 values.
Enter the four cell counts of your 2×2 contingency table directly.
| Cured | Not Cured | |
|---|---|---|
| Treatment | ||
| Placebo |
⚙️ Step 2 — Test Configuration
📌 When to Use Fisher's Exact Test
This free Fisher's exact test calculator is designed for researchers, students, and analysts who need a non-parametric test of association for 2×2 contingency tables — particularly when sample sizes are small or expected frequencies fall below 5.
Quick Decision Checklist
- ✅ You have two categorical variables, each with two levels (binary outcome × binary group).
- ✅ Your data form a 2×2 contingency table of counts.
- ✅ Any expected cell count is below 5, or your total sample size is small (n < 20).
- ✅ Observations are independent (no participant appears in more than one cell).
- ✅ You want an exact p-value rather than a chi-square approximation.
Real-World Examples
Compare cure rates between a new drug (12/15 cured) and placebo (3/15 cured) in a small phase-I trial.
Test whether vaccination status is associated with infection in a small outbreak investigation.
Compare pass / fail rates between two teaching methods in a pilot classroom of 25 students.
Test whether species detection differs between two forest patches across a small camera-trap survey.
Decision Tree — Fisher vs Chi-Square vs McNemar
- Fisher's exact → Independent groups, 2×2 table, any expected count < 5, or total n small.
- Chi-square → Independent groups, all expected counts ≥ 5, total n ≥ 30.
- McNemar's → Paired binary data (same subjects measured twice).
🧮 Technical Notes — Formulas
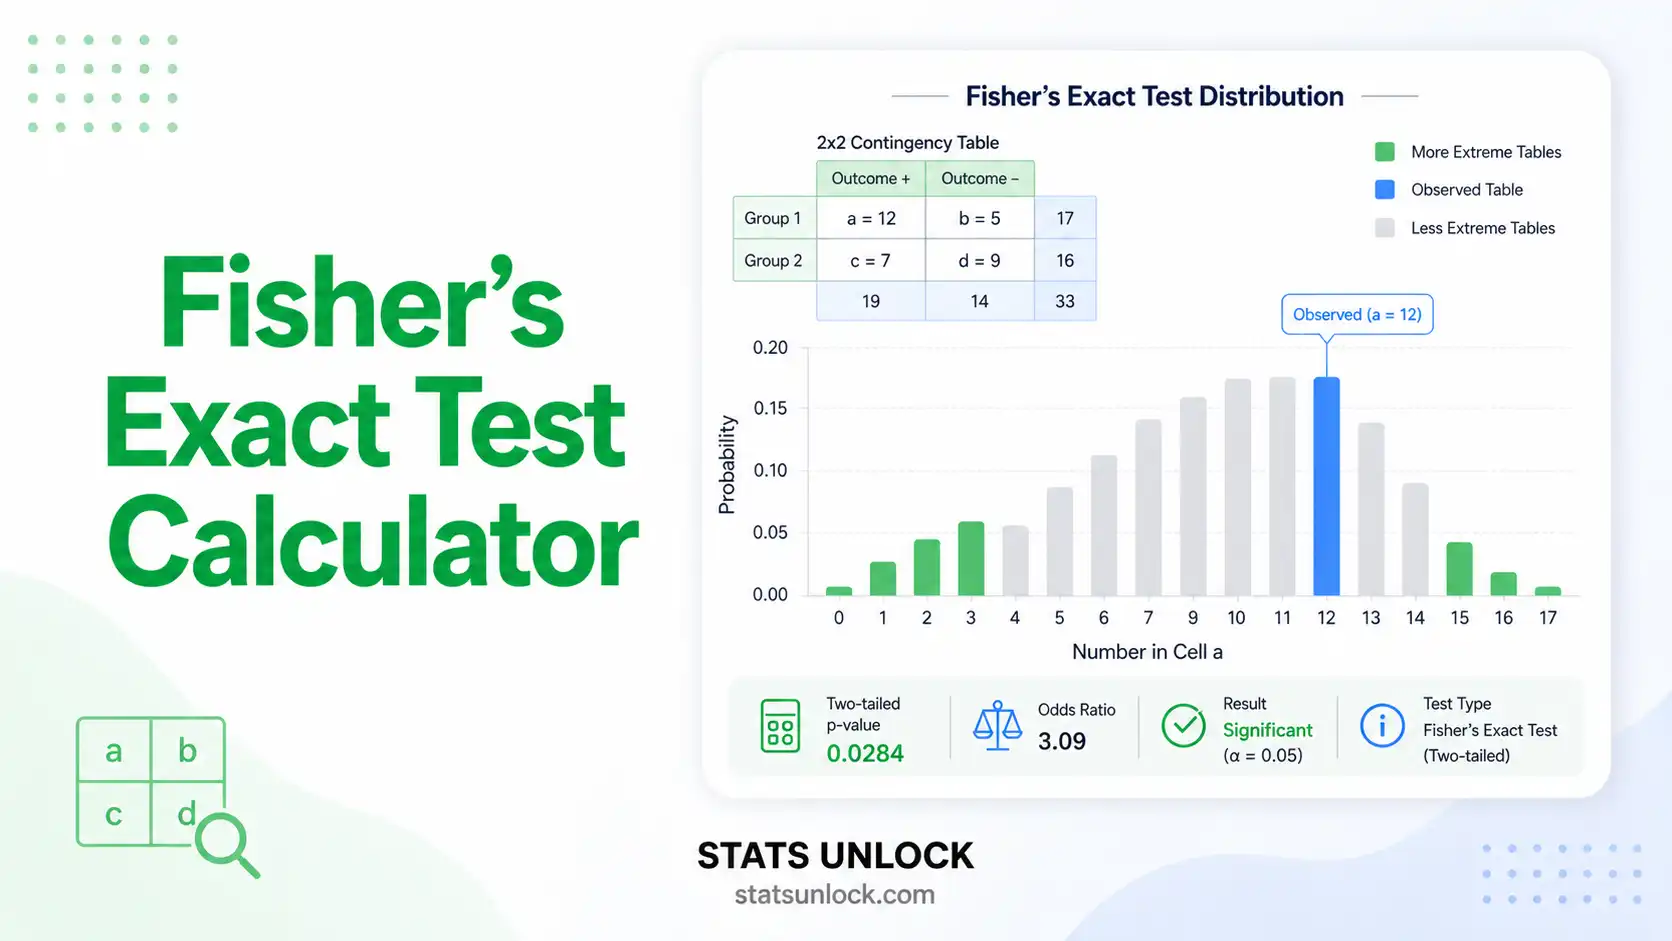
The Fisher's exact test computes the probability of the observed 2×2 table directly from the hypergeometric distribution, conditioning on the row and column marginal totals.
The 2×2 Table Notation
| Outcome + | Outcome − | Row Total | |
|---|---|---|---|
| Group 1 | a | b | a + b |
| Group 2 | c | d | c + d |
| Col Total | a + c | b + d | n |
Hypergeometric Probability of the Observed Table
Two-Tailed P-Value (Sum of "as extreme or more" tables)
Sample Odds Ratio (OR) and 95% CI (Woolf's method)
SE(log OR) = √(1/a + 1/b + 1/c + 1/d)
95% CI = exp[ log(OR) ± 1.96 × SE(log OR) ]
Effect Sizes for 2×2 Tables
Cramér's V = |φ| (for a 2×2 table)
Risk Difference (RD) = a/(a+b) − c/(c+d)
Relative Risk (RR) = [a/(a+b)] / [c/(c+d)]
🎯 Competitor Gap Keywords & Content Gaps to Fill
Topics most ranked Fisher's exact test pages miss — covering these gives this page a real ranking advantage on Google, Perplexity, and AI Overviews.
🔍 Competitor Gap Keywords
- fisher exact test for small sample size
- fisher exact test apa format example
- one tailed fisher exact test calculator
- fisher exact test interpretation example
- fisher exact test for clinical trials
- fisher test vs chi square decision rule
- fisher exact test odds ratio confidence interval
- how to calculate fisher exact test by hand
- fisher exact test for medical research
- fisher exact test in r vs python vs spss
📝 Content Gaps to Fill on This Page
- Step-by-step hand calculation worked example
- Hypergeometric distribution intuition for non-statisticians
- 5 publication-ready APA / thesis / poster reporting styles
- Direct chi-square vs Fisher decision tree
- One-tailed vs two-tailed when to choose each
- Continuity correction for zero cells (Haldane–Anscombe)
- Mosaic plot + odds-ratio forest plot visualization
- Mid-P p-value alternative for borderline results
- Power and minimum detectable effect for 2×2 tables
- Reporting in pre-registration / open-science formats
📘 How to Use This Fisher's Exact Test Calculator
A first-time walkthrough using the pre-loaded Drug Trial dataset (Treatment vs Placebo, Cured vs Not Cured).
Enter Your Data
Choose one of three input modes — paste comma-separated 0/1 outcomes per group, upload a CSV/Excel file, or fill the 2×2 table directly.
Example: Treatment = "1, 1, 1, 1, 1, 1, 1, 1, 1, 1, 1, 1, 0, 0, 0" (12 cured, 3 not cured).
Choose a Sample Dataset
Pick from 5 built-in datasets across medicine, public health, education, marketing, and ecology to see how the tool behaves on different effect sizes.
Sample 1 = Drug Trial (loaded by default); Sample 5 = Wildlife camera-trap detection.
Configure Test Settings
Set α (typically 0.05), pick two-tailed (default), one-tailed-left, or one-tailed-right, and choose the Woolf or Mid-P CI method for the odds ratio.
Default α = 0.05 with two-tailed test gives a 95% confidence interval.
Run the Analysis
Click ▶ Run Analysis. Computation completes in < 50 ms even for moderately sized 2×2 tables.
Output appears below — 2×2 table, summary cards, full results, charts, and interpretation.
Read the Summary Cards
Four colored cards show p-value, odds ratio, sample size, and effect size (phi). Green = significant; amber = borderline; red = non-significant.
p = 0.002 (green), OR = 16.0 (green), n = 30, φ = 0.60 (large effect).
Read the Full Results Table
Every statistic is listed with its computed value and a plain-language description. Confidence intervals appear for OR, RR, and RD.
Look for the "two-tailed p-value" row — color-coded red if non-significant, green if significant.
Examine the Visualizations
Four charts: (1) mosaic / proportion bars, (2) hypergeometric distribution with observed cell highlighted, (3) observed-vs-expected counts, (4) odds-ratio forest plot with 95% CI.
A vertical line at OR = 1 in chart 4 — if the CI crosses it, the association is not significant.
Check the Assumptions
Three assumption badges (Pass / Warn / Fail) cover independence, fixed marginals, and binary outcomes.
A "Warn" badge on independence prompts you to verify no participant appears in two cells.
Read the Interpretation
Five auto-filled paragraphs explain the result, the p-value, the effect size, practical significance, and limitations — designed for non-statisticians.
Each paragraph adapts to your data — significant vs non-significant wording flips automatically.
Export Your Results
Download a plain-text Doc (.txt) for sharing or a PDF (browser print → Save as PDF) for archiving.
The PDF contains the full report — table, statistics, interpretation, APA quote, references.
❓ Frequently Asked Questions
Q1. What is Fisher's exact test and when should I use it?
Fisher's exact test is a non-parametric test of association for 2×2 contingency tables. It computes the exact probability of seeing your data (or a more extreme pattern) under the null hypothesis of independence between two binary variables. Use it whenever sample size is small or any expected cell count is below 5 — the exact p-value remains valid even when the chi-square approximation breaks down.
Common settings: small clinical trials, pilot studies, rare-event outcomes, sparse case-control tables, and 2×2 wildlife or ecological detection comparisons.
Q2. What is a p-value, and how do I interpret it for Fisher's exact test?
The p-value is the exact probability of observing the current 2×2 table — or a more extreme one — given that the two variables are truly independent (the null hypothesis). It is computed by summing hypergeometric probabilities across all tables with the same row and column totals as yours.
For example, a p-value of 0.024 means: "If chance alone were operating, there is a 2.4% probability of seeing an association this strong or stronger." A p-value is not the probability that the null hypothesis is true.
Q3. What does statistical significance mean — and does it equal practical importance?
Statistical significance (p < α) means the data are unlikely under independence. It does not automatically mean the effect is large or clinically important — particularly when sample sizes are large.
Always inspect the odds ratio, risk difference, and phi alongside the p-value. A statistically significant OR of 1.05 may be irrelevant in practice, while a non-significant OR of 4.0 in a tiny sample may still warrant follow-up.
Q4. What is the odds ratio and how do I interpret it?
The odds ratio (OR) compares the odds of the outcome between the two groups. OR = 1 means no association; OR > 1 means the exposure increases the odds; OR < 1 means it decreases them.
Interpret in plain English: an OR of 4.0 means the odds of the outcome in Group 1 are 4 times the odds in Group 2. Always report the 95% confidence interval — if it includes 1, the association is not statistically significant at α = 0.05.
Q5. What assumptions does Fisher's exact test require?
Three core assumptions: (1) Independence — every observation belongs to exactly one cell, and observations do not influence one another; (2) Fixed marginals — the test conditions on the row and column totals; (3) Binary categories — both variables have exactly two levels.
If observations are paired (same subjects measured twice), use McNemar's test. If your table is larger than 2×2, use the Fisher-Freeman-Halton extension or chi-square (with adequate cell counts).
Q6. How large a sample do I need for Fisher's exact test?
Fisher's exact test has no minimum sample size. It is in fact preferred for very small samples where chi-square's approximation fails. However, very small totals (n < 10) may have low statistical power — even a strong real association may not reach significance.
Rule of thumb: to detect a moderate-to-large odds ratio (OR ≈ 4) at α = 0.05 with 80% power, you typically need 30–60 observations. Use a power calculator for your specific design.
Q7. One-tailed vs two-tailed Fisher's exact test — which should I use?
Use two-tailed by default. Two-tailed tests detect associations in either direction and are the standard expected by most journals.
Use one-tailed only when you have a strong, pre-specified directional hypothesis declared before data collection (e.g., "the new drug will be more effective than placebo"). One-tailed tests are more powerful but commit you to a direction; switching after seeing the data is data dredging.
Q8. How do I report Fisher's exact test in APA 7th edition format?
Standard APA 7 sentence: "A Fisher's exact test indicated a significant association between treatment group and clinical outcome, p = .002, OR = 16.00, 95% CI [3.30, 77.40]."
Italicise p, OR, CI; report exact p to three decimals (or "p < .001"); always include the OR with its CI. The "How to Write Your Results" section above auto-fills five complete reporting templates with your computed values.
Q9. Can I use this calculator for my published research or thesis?
This Fisher's exact test calculator is built for educational use, exploratory analysis, and rapid checking. For peer-reviewed publication, cross-validate with established statistical software — R's fisher.test(), Python's scipy.stats.fisher_exact(), or SPSS Crosstabs with the "Exact" option — all of which use the same hypergeometric algorithm.
Cite the tool as: StatsUnlock. (2025). Fisher's Exact Test Calculator. Retrieved from https://statsunlock.com.
Q10. What if my Fisher's exact test result is non-significant?
A non-significant p-value (p > α) does not prove independence. It only means the data do not provide sufficient evidence to reject independence. Possible reasons include small sample size, low statistical power, a true small effect, or genuine independence.
Check the confidence interval for the odds ratio — a wide CI signals an under-powered study. For quantifying evidence in favour of the null, consider a Bayesian approach (Bayes Factor for 2×2 tables).
📚 References
The following peer-reviewed and authoritative sources underpin every formula in this Fisher's exact test calculator, including its exact p-value algorithm and odds ratio confidence interval methodology.
- Fisher, R. A. (1922). On the interpretation of χ² from contingency tables, and the calculation of P. Journal of the Royal Statistical Society, 85(1), 87–94. https://doi.org/10.2307/2340521
- Fisher, R. A. (1935). The Design of Experiments. Edinburgh: Oliver and Boyd.
- Agresti, A. (2013). Categorical Data Analysis (3rd ed.). Hoboken, NJ: Wiley. Wiley
- Mehta, C. R., & Patel, N. R. (1983). A network algorithm for performing Fisher's exact test in r × c contingency tables. Journal of the American Statistical Association, 78(382), 427–434. https://doi.org/10.1080/01621459.1983.10477989
- Upton, G. J. G. (1982). A comparison of alternative tests for the 2 × 2 comparative trial. Journal of the Royal Statistical Society A, 145(1), 86–105. https://doi.org/10.2307/2981423
- Lydersen, S., Fagerland, M. W., & Laake, P. (2009). Recommended tests for association in 2 × 2 tables. Statistics in Medicine, 28(7), 1159–1175. https://doi.org/10.1002/sim.3531
- Cohen, J. (1988). Statistical Power Analysis for the Behavioral Sciences (2nd ed.). Hillsdale, NJ: Lawrence Erlbaum.
- Woolf, B. (1955). On estimating the relation between blood group and disease. Annals of Human Genetics, 19(4), 251–253. https://doi.org/10.1111/j.1469-1809.1955.tb01348.x
- Haldane, J. B. S. (1956). The estimation and significance of the logarithm of a ratio of frequencies. Annals of Human Genetics, 20(4), 309–311. https://doi.org/10.1111/j.1469-1809.1955.tb01285.x
- Lancaster, H. O. (1961). Significance tests in discrete distributions. Journal of the American Statistical Association, 56(294), 223–234. https://doi.org/10.1080/01621459.1961.10482107
- Hirji, K. F. (2005). Exact Analysis of Discrete Data. Boca Raton, FL: Chapman & Hall/CRC.
- Field, A. (2017). Discovering Statistics Using IBM SPSS Statistics (5th ed.). London: Sage.
- R Core Team. (2024). R: A language and environment for statistical computing. R Foundation for Statistical Computing. https://www.R-project.org/
- Virtanen, P., Gommers, R., Oliphant, T. E., et al. (2020). SciPy 1.0: Fundamental algorithms for scientific computing in Python. Nature Methods, 17, 261–272. https://doi.org/10.1038/s41592-020-0772-5
- American Psychological Association. (2020). Publication Manual of the American Psychological Association (7th ed.). Washington, DC: APA.


