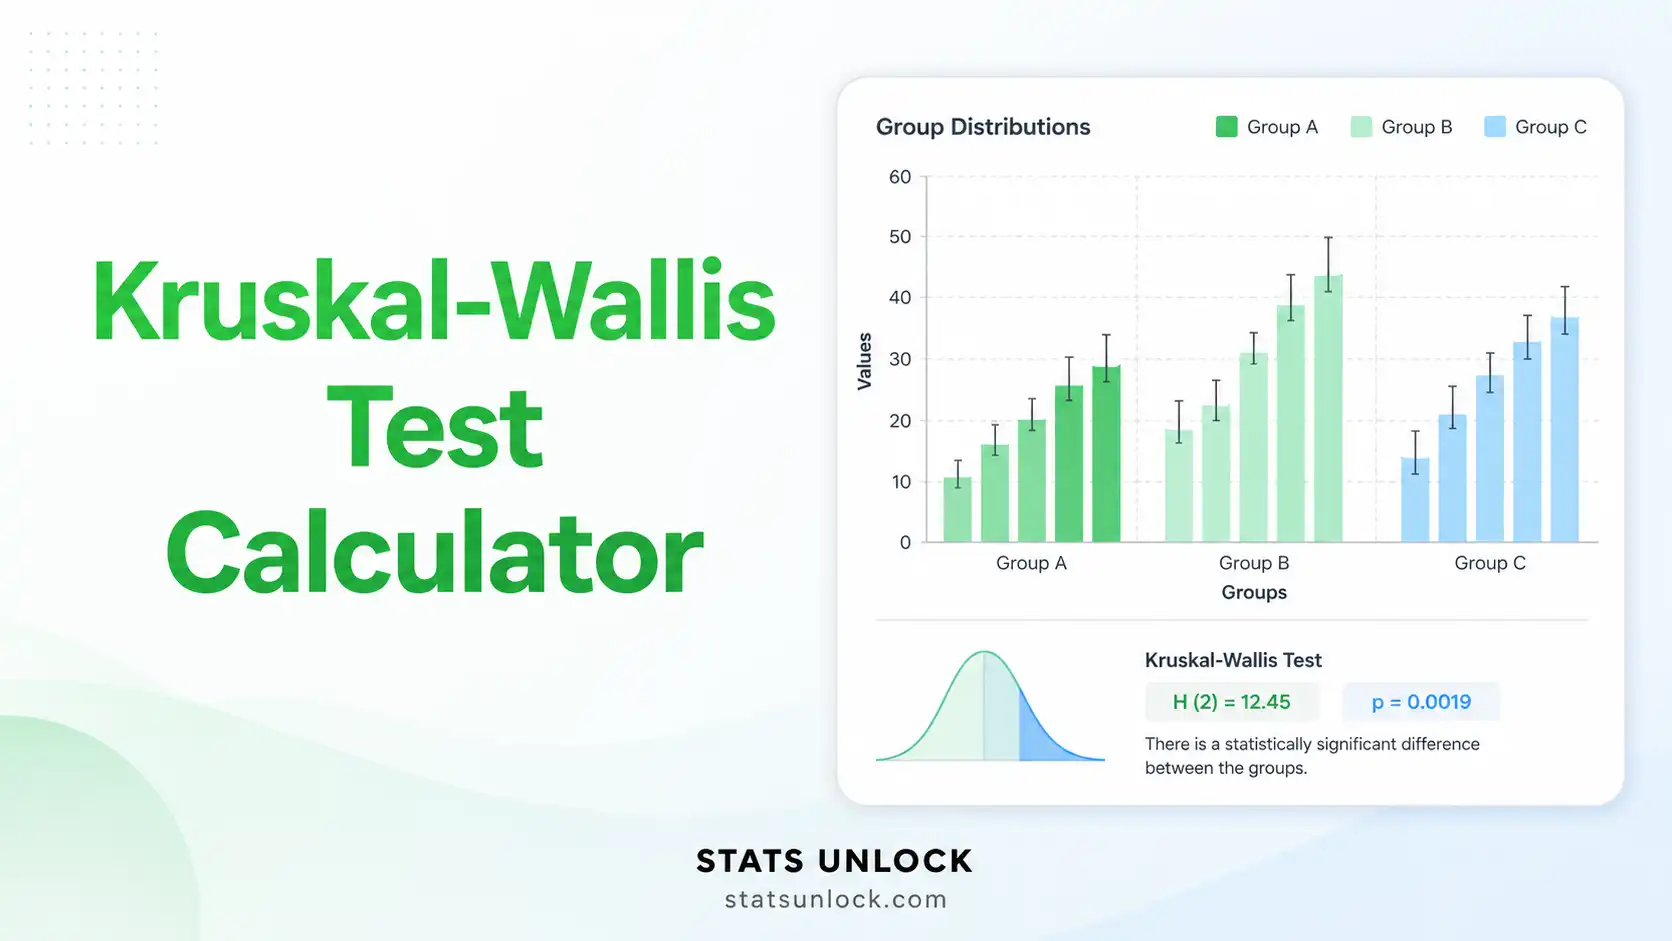
Kruskal-Wallis Test
Calculator
A free online non-parametric ANOVA calculator. Compare 3 or more independent groups, get H statistic, p-value, epsilon-squared effect size, Dunn's post-hoc test, and APA-ready reporting.
📥 1. Enter Your Data
⚙ 2. Configure the Test
📐 Technical Notes & Formulas
Test Statistic — Kruskal-Wallis H
Tie Correction
Degrees of Freedom & p-value
p-value = P(χ² > H | df = k − 1)
The p-value is computed from the chi-square distribution with k − 1 degrees of freedom (right-tailed; Kruskal-Wallis is always one-tailed).
Effect Size — Epsilon-Squared (ε²)
Effect Size — Eta-Squared (η²H)
Dunn's Post-hoc Test
Why Kruskal-Wallis (Technical Notes)
- Robust to non-normal data — works on ordinal or skewed continuous data.
- Tests whether group distributions are identical; with similar shapes, it tests differences in medians.
- The chi-square approximation is reliable when each group has at least 5 observations.
- If significant, run Dunn's post-hoc with adjustment to identify which pairs differ.
- Loses power compared to one-way ANOVA when ANOVA assumptions actually hold.
🎯 When to Use This Kruskal-Wallis Test
This free Kruskal-Wallis test calculator is designed for researchers, students, and analysts who need a non-parametric alternative to one-way ANOVA. Use it whenever you compare a continuous or ordinal outcome across three or more independent groups and the data are skewed, ordinal, or fail normality.
Decision Checklist
- ✅ You have 3 or more independent groups
- ✅ Your dependent variable is ordinal or continuous
- ✅ Observations within each group are independent
- ✅ Data are not normally distributed (or sample is small)
- ❌ Do NOT use if groups are paired/repeated → use Friedman test
- ❌ Do NOT use if you have only 2 groups → use Mann-Whitney U test
- ❌ Do NOT use if data are normally distributed and variances equal → use One-Way ANOVA (more powerful)
Real-World Examples
- Education — comparing exam scores across three teaching methods (lecture, flipped, online) with skewed grade distributions.
- Medical Research — comparing pain scores (1–10 ordinal scale) across four drug regimens.
- Ecology — comparing species abundance counts across five forest habitat types where counts are right-skewed.
- Psychology — comparing depression inventory scores across three therapy types in a small clinical trial.
- Business — comparing customer satisfaction ratings (1–10) across three retail stores.
Sample Size Guidance
- Minimum recommended: 5 observations per group for chi-square approximation.
- For reliable detection of medium effects (ε² ≈ .06): n ≥ 15 per group.
- For small effects: aim for n ≥ 30 per group.
- With fewer than 5 per group, use exact permutation tests (run 10,000 iterations in R via the
coinpackage).
Decision Tree — Picking the Right Test
📘 How to Use This Kruskal-Wallis Calculator
Follow these 10 steps to run a complete Kruskal-Wallis analysis on your data.
Step 1 — Enter Your Data
Three input options: (a) Paste comma-separated values per group, (b) upload a CSV/Excel file, or (c) type values into the manual table. Each group needs at least 2 values; 5+ is recommended.
Step 2 — Choose a Sample Dataset
Five built-in datasets cover education, pharmacology, agriculture, sleep research, and customer satisfaction. Dataset 1 (Teaching Method exam scores) loads on first render.
Step 3 — Configure Test Settings
Set α (default .05), choose a post-hoc method (Dunn's with Bonferroni is the conservative default), and decide on tie correction (recommended on).
Step 4 — Run the Analysis
Click the green "Run Kruskal-Wallis Analysis" button. Computation is instant for any reasonable dataset size.
Step 5 — Read the Summary Cards
Four cards show H, df, p-value, and ε² effect size. The p-value card is colored green when significant, red when not.
Step 6 — Read the Full Results Table
The full table shows H, H corrected for ties, df, p-value, sample size, all group medians, mean ranks, both effect sizes (ε² and η²H), and your interpretation labels.
Step 7 — Examine Both Visualizations
Chart 1 is a box plot per group with jittered raw data — look for medians, IQR, and outliers. Chart 2 plots the chi-square distribution with H marked and the rejection region shaded.
Step 8 — Check Assumptions
Independence (must be design-checked), no severe ties, and similar distribution shapes are flagged. Severe shape differences mean H tests distributions, not medians.
Step 9 — Read the Interpretation & Write-Up
Five ready-made paragraphs (APA, Thesis, Plain-Language, Abstract, Pre-Registration) auto-fill with your numbers — copy whichever fits your venue.
Step 10 — Export Your Results
Two buttons: Download Doc gives a plain-text .txt report. Download PDF triggers print-to-PDF with the full structured report.
❓ Frequently Asked Questions
Q1. What is the Kruskal-Wallis test and when should I use it?
The Kruskal-Wallis H test is a non-parametric test that compares the distributions of three or more independent groups using ranked data. It is the rank-based equivalent of one-way ANOVA. Use it when you would run a one-way ANOVA but your data are ordinal, skewed, or fail the normality assumption — for example, comparing patient pain scores across four drug treatments.
Q2. What is a p-value, and how do I interpret it for the Kruskal-Wallis test?
The p-value is the probability of obtaining an H statistic as extreme as the one observed if all groups truly came from identical distributions. It is not the probability that the null hypothesis is true. Example: a p-value of .03 means there is a 3% chance of seeing this result by chance if no real difference existed; reject H₀ when p < α.
Q3. Does statistical significance equal practical importance?
No. With large samples a Kruskal-Wallis test can flag tiny, practically irrelevant differences as significant. Always report effect size (epsilon-squared or eta-squared H) alongside the p-value, and judge whether the magnitude matters in your domain — a 1-point difference on a 10-point scale rarely changes clinical or business decisions.
Q4. What is epsilon-squared and how do I interpret it?
Epsilon-squared (ε²) is the proportion of variance in ranks explained by group membership. Cohen-style benchmarks (Tomczak & Tomczak, 2014): < .01 negligible, .01–.06 small, .06–.14 medium, and > .14 large. A large effect (ε² > .14) means the groups differ in ways most observers would notice without statistics.
Q5. What assumptions does the Kruskal-Wallis test require?
Three core assumptions: (a) observations are independent within and between groups, (b) the dependent variable is ordinal or continuous, and (c) group distributions have similar shapes if the result is to be interpreted as a difference in medians. If shapes differ, the result is more general — a difference in distributions. Violation of independence is fatal; violation of shape similarity narrows the interpretation.
Q6. How large a sample do I need for Kruskal-Wallis to be reliable?
At least 5 observations per group is the minimum for the chi-square approximation to behave well. For 80% power to detect a medium effect (ε² ≈ .06) with three groups at α = .05, plan for roughly 15–20 per group; for small effects, aim for 30+ per group. With fewer than 5 per group, switch to exact permutation methods.
Q7. Is Kruskal-Wallis one-tailed or two-tailed?
Kruskal-Wallis is always evaluated on the right tail of the chi-square distribution. The H statistic is non-negative, and a large H signals divergence among groups in either direction. There is no one-tailed vs two-tailed choice for the omnibus test — directional questions should be answered with planned post-hoc comparisons.
Q8. How do I report Kruskal-Wallis results in APA 7th edition format?
Report H with degrees of freedom in parentheses, the exact p-value (or p < .001), and an effect size: H(2) = 14.32, p < .001, ε² = .26. When significant, follow with Dunn's post-hoc results and corrected p-values. See the "How to Write Your Results" section above for five fully filled-in templates.
Q9. Can I use this calculator for my published research or thesis?
Yes — for educational use, exploratory analysis, and thesis chapter drafts. For final journal submissions, replicate results in R (kruskal.test(), FSA::dunnTest()) or Python (scipy.stats.kruskal, scikit-posthocs). Cite the tool as: STATS UNLOCK. (2026). Kruskal-Wallis test calculator. Retrieved from https://statsunlock.com.
Q10. What if my Kruskal-Wallis result is non-significant — is my hypothesis wrong?
A non-significant result (p > α) does not prove the null hypothesis. It only means the data do not provide enough evidence to reject H₀. The cause may be a small effect, low sample size, low power, or genuine equivalence. Run a power analysis to check whether your study could plausibly detect the effect you cared about, and consider a Bayesian alternative if you want positive evidence for equivalence.
📚 References
The following references support the statistical methods used in this Kruskal-Wallis test calculator, covering p-value interpretation, effect size, and best practices in non-parametric hypothesis testing.
- Kruskal, W. H., & Wallis, W. A. (1952). Use of ranks in one-criterion variance analysis. Journal of the American Statistical Association, 47(260), 583–621. https://doi.org/10.1080/01621459.1952.10483441
- Dunn, O. J. (1964). Multiple comparisons using rank sums. Technometrics, 6(3), 241–252. https://doi.org/10.1080/00401706.1964.10490181
- Conover, W. J., & Iman, R. L. (1981). Rank transformations as a bridge between parametric and nonparametric statistics. The American Statistician, 35(3), 124–129. https://doi.org/10.1080/00031305.1981.10479327
- Tomczak, M., & Tomczak, E. (2014). The need to report effect size estimates revisited. An overview of some recommended measures of effect size. Trends in Sport Sciences, 1(21), 19–25.
- Cohen, J. (1988). Statistical power analysis for the behavioral sciences (2nd ed.). Lawrence Erlbaum Associates.
- Field, A. (2018). Discovering statistics using IBM SPSS statistics (5th ed.). SAGE Publications.
- Hollander, M., Wolfe, D. A., & Chicken, E. (2014). Nonparametric statistical methods (3rd ed.). Wiley. https://doi.org/10.1002/9781119196037
- Siegel, S., & Castellan, N. J. (1988). Nonparametric statistics for the behavioral sciences (2nd ed.). McGraw-Hill.
- Benjamini, Y., & Hochberg, Y. (1995). Controlling the false discovery rate: A practical and powerful approach to multiple testing. Journal of the Royal Statistical Society: Series B, 57(1), 289–300. https://doi.org/10.1111/j.2517-6161.1995.tb02031.x
- Lakens, D. (2013). Calculating and reporting effect sizes to facilitate cumulative science. Frontiers in Psychology, 4, 863. https://doi.org/10.3389/fpsyg.2013.00863
- American Psychological Association. (2020). Publication manual of the American Psychological Association (7th ed.). APA. https://doi.org/10.1037/0000165-000
- R Core Team. (2024). R: A language and environment for statistical computing. R Foundation for Statistical Computing. https://www.R-project.org/
- Virtanen, P., Gommers, R., Oliphant, T. E., et al. (2020). SciPy 1.0: Fundamental algorithms for scientific computing in Python. Nature Methods, 17, 261–272. https://doi.org/10.1038/s41592-020-0772-5
- Mangiafico, S. S. (2016). Summary and analysis of extension program evaluation in R, version 1.20.05. https://rcompanion.org/handbook/
- NIST/SEMATECH. (2013). e-Handbook of statistical methods. National Institute of Standards and Technology. https://www.itl.nist.gov/div898/handbook/


