Z-Score Calculator — Standard Score & Percentile Tool
Compute Z-scores (standard scores) from raw data, mean, and standard deviation. Get percentile ranks, probability values, outlier flags, and a full normal distribution visualization — all free, instant, and browser-based.
Data Input
Enter a single value with known mean and standard deviation to get an instant Z-score.
Standard normal table — area to the left of Z (cumulative probability). Highlighted values are commonly referenced in statistics.
- You want to compare values from datasets with different units or scales
- You need to identify outliers in a continuous variable
- You want to know where a single value ranks within a distribution
- You are standardizing predictors before regression or machine learning
- You are working with a large sample (n ≥ 30) or known population σ
- You need to compute a one-sample z-test statistic
✅ Use Z-Scores When
- Data is continuous and numeric
- Distribution is approximately normal
- Comparing across different scales
- Detecting statistical outliers
⚠️ Use Caution When
- Sample size is very small (n < 10)
- Distribution is heavily skewed
- Data contains ordinal or categorical values
- Outliers inflate the standard deviation
📊 Real-World Examples
- Standardizing exam scores
- Quality control in manufacturing
- Clinical lab reference ranges
- Financial risk z-scores (Altman Z)
🔄 Decision Tree
- Need relative ranking → Z-score
- Unknown σ, small n → use t-score
- Skewed data → use IQR / median
- Categorical data → chi-square
Choose your input method
Use the tabs to paste data, upload a file, or enter a single value manually.
Load a sample dataset (optional)
Use the dropdown to explore pre-loaded datasets (heights, scores, temperatures, weights, reaction times).
Paste or type your data
Enter numbers separated by commas, spaces, or newlines. Decimals and negatives are supported.
Upload a file (optional)
Upload .csv, .txt, .xlsx, or .xls files. A column picker will appear for multi-column files.
Set significance level
Choose α = 0.05, 0.01, or 0.10. This determines the outlier classification threshold.
Click "Run Z-Score Analysis"
The tool calculates Z-scores, percentiles, probability values, and outlier status for every data point.
Read the Key Statistics panel
Review mean, SD, min/max Z-score, and the count of outliers flagged in your dataset.
Explore the charts
The dot-plot shows Z-scores relative to ±1, ±2, ±3 bands; the curve shows where your data falls on the normal distribution.
Use the writing examples
Copy APA, thesis, or plain-language report text with your actual numbers pre-filled.
Export your results
Download as .txt, .xlsx, .docx, or PDF. All exports include the full Z-score table and interpretation.
What is a Z-score in statistics?
How do you calculate a Z-score step by step?
What is a good Z-score?
How do I convert a Z-score to a percentile?
What does a negative Z-score mean?
Should I use population or sample standard deviation for Z-scores?
How do Z-scores help identify outliers?
What is the difference between Z-score and T-score?
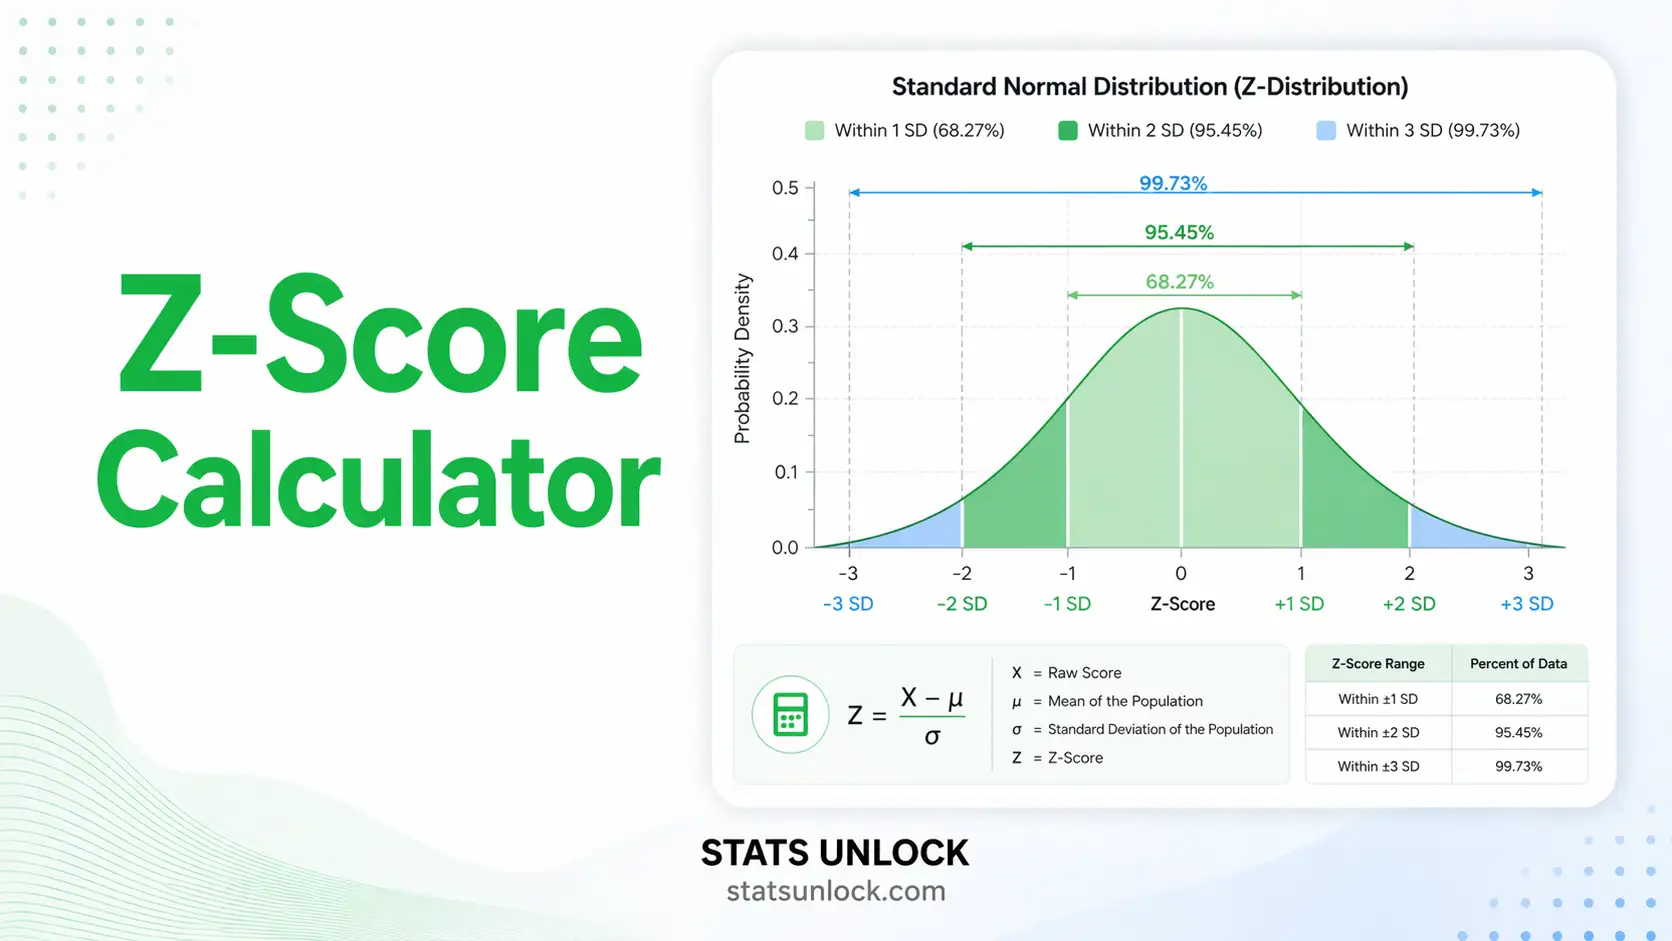
What is the 68-95-99.7 rule (Empirical Rule)?
Can I use Z-scores with non-normal data?
The Z-score calculator and its standard score interpretations are grounded in classical descriptive statistics and inferential methodology. The following references support the formulas, percentile conversions, and outlier criteria implemented in this tool.
- Field, A. (2018). Discovering statistics using IBM SPSS statistics (5th ed.). SAGE Publications. https://doi.org/10.1177/0013164418776504
- Tabachnick, B. G., & Fidell, L. S. (2019). Using multivariate statistics (7th ed.). Pearson. ISBN: 978-0134790541.
- Zar, J. H. (2010). Biostatistical analysis (5th ed.). Prentice Hall. ISBN: 978-0131008465.
- Cohen, J. (1988). Statistical power analysis for the behavioral sciences (2nd ed.). Lawrence Erlbaum Associates. https://doi.org/10.4324/9780203771587
- Abdi, H. (2007). Z-scores. In N. J. Salkind (Ed.), Encyclopedia of measurement and statistics. SAGE Publications. https://doi.org/10.4135/9781412952644
- Iglewicz, B., & Hoaglin, D. C. (1993). How to detect and handle outliers. ASQC Quality Press. ISBN: 978-0873892476.
- Tukey, J. W. (1977). Exploratory data analysis. Addison-Wesley. ISBN: 978-0201076165.
- Moore, D. S., McCabe, G. P., & Craig, B. A. (2021). Introduction to the practice of statistics (10th ed.). W. H. Freeman. ISBN: 978-1319269357.
- R Core Team. (2024). R: A language and environment for statistical computing. R Foundation for Statistical Computing. https://www.R-project.org/
- Altman, E. I. (1968). Financial ratios, discriminant analysis and the prediction of corporate bankruptcy. Journal of Finance, 23(4), 589–609. https://doi.org/10.1111/j.1540-6261.1968.tb00843.x
- Bland, J. M., & Altman, D. G. (1996). Statistics notes: Measurement error. BMJ, 313(7059), 744. https://doi.org/10.1136/bmj.313.7059.744
- Grambsch, P. M., & Therneau, T. M. (1994). Proportional hazards tests and diagnostics based on weighted residuals. Biometrika, 81(3), 515–526. https://doi.org/10.1093/biomet/81.3.515
- Montgomery, D. C., & Runger, G. C. (2018). Applied statistics and probability for engineers (7th ed.). Wiley. ISBN: 978-1119400363.


