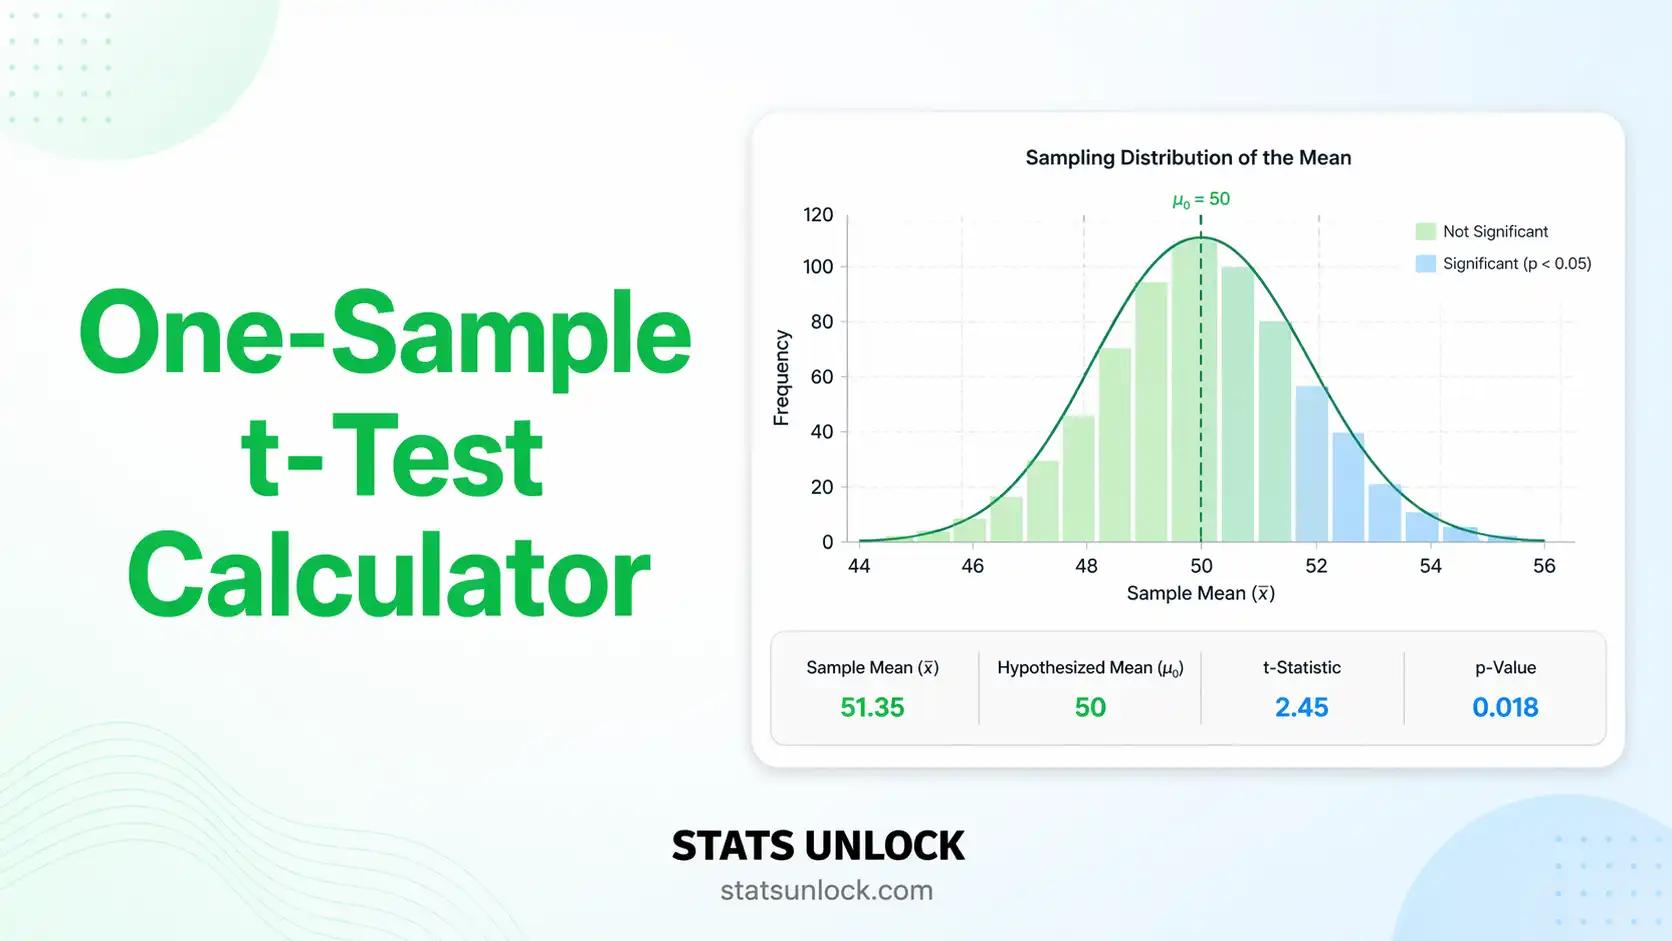
One-Sample t-Test Calculator
Test whether your sample mean is significantly different from a known or hypothesised value — with detailed interpretation, effect size, and four visualisation plots.
📥 Enter Your Data
Type values directly into the cells below. Click + Add Row to add more rows.
| # | Value |
|---|
⚙️ Test Configuration
🧮 Technical Notes & Formulas
Formulas Used
Cohen's d Benchmarks
| |d| value | Interpretation | Practical meaning |
|---|---|---|
| < 0.20 | Negligible effect | Difference barely detectable in practice |
| 0.20 – 0.49 | Small effect | Noticeable to careful observers |
| 0.50 – 0.79 | Medium effect | Visible to the naked eye |
| ≥ 0.80 | Large effect | Obvious, substantial difference |
| ≥ 1.20 | Very large effect | Dominant difference (Sawilowsky, 2009) |
| ≥ 2.00 | Huge effect | Exceptional difference across virtually all individuals |
Technical Notes
- The one-sample t-test is robust to mild violations of normality when n ≥ 30 (Central Limit Theorem).
- Outliers inflate the sample SD and reduce the t-statistic; inspect the box plot for extreme values.
- For small samples (n < 30) with non-normal data, consider the Wilcoxon Signed-Rank test.
- When the population standard deviation (σ) is known, use a one-sample z-test instead.
- The Shapiro-Wilk approximation uses a polynomial approach (Royston, 1992) accurate for n 3–5000.
- p-values are computed from the Student's t-distribution CDF via a regularised incomplete Beta function approximation.
📋 When to Use the One-Sample t-Test
The one-sample t-test answers one question: "Is my sample mean significantly different from a specific target value?" You need only one group of continuous measurements and a meaningful hypothesised value to compare against.
✅ Decision Checklist
- ✅ You have ONE group of numeric measurements
- ✅ Your variable is continuous (interval or ratio scale)
- ✅ Observations are independent of each other
- ✅ Data are approximately normally distributed, OR n ≥ 30
- ✅ You have a specific numeric target value (μ₀) to compare against
- ❌ Do NOT use if you have TWO groups → use Independent-Samples t-Test
- ❌ Do NOT use if measurements are PAIRED (pre/post on same subjects) → use Paired t-Test
- ❌ Do NOT use if data are ordinal or severely non-normal with n < 30 → use Wilcoxon Signed-Rank
- ❌ Do NOT use if population SD (σ) is known → use One-Sample z-Test
🌍 Real-World Examples
🏥 Medical / Clinical
A hospital measures the resting heart rate of 25 patients after a new therapy. The healthy population mean is 72 bpm. The one-sample t-test checks whether patients significantly differ from this standard.
🎓 Education
A class of 30 students scores an average of 74% on a national exam. The national average is 70%. The t-test determines if this class performs significantly above the national norm.
🏭 Quality Control
A factory claims each product weighs exactly 500 g. A quality inspector samples 20 units. The one-sample t-test tests whether the batch mean deviates from the 500 g specification.
🌱 Ecology / Field Research
A field researcher records soil pH at 18 plots in a study area. Regional background pH is 6.5. The t-test checks whether human activity has shifted the pH significantly.
🌳 Decision Tree
📖 How to Use This Calculator (Step-by-Step Guide)
- Enter your data — type or paste values separated by commas, spaces, or line breaks. Example:
118, 124, 131, 109, 127. - Choose a sample dataset — five real-world scenarios are pre-loaded. Dataset 1 (systolic blood pressure) is auto-loaded so you can see results immediately.
- Edit the group name — type a meaningful label (e.g., "Hypertensive Patients") so it appears correctly in reports and export files.
- Upload a CSV or Excel file — switch to the Upload tab, select your file, then click the column containing your measurements. Works with .csv, .txt, .xlsx, and .xls.
- Set the hypothesised mean (μ₀) — this is the target value you are comparing against. Use the population mean, a regulatory standard, or a manufacturer's specification.
- Choose significance level (α) — 0.05 is the standard in most fields. Stricter studies use 0.01. The CI width adjusts automatically.
- Select tail type — Two-tailed tests for any difference (most common). Right-tailed if you predict the mean is higher. Left-tailed if you predict lower.
- Click "Run One-Sample t-Test" — results, charts, and interpretation appear instantly below.
- Read the four charts — Chart ① shows where your t-statistic falls in the t-distribution. Chart ② shows a box plot with raw data points. Chart ③ shows a histogram with a normal curve overlay. Chart ④ shows the confidence interval alongside μ₀.
- Export your results — "Download Doc" saves a plain-text summary. "Download PDF" opens a print-ready A4 report. Copy any of the five reporting templates with the 📋 Copy button.
❓ Frequently Asked Questions
Q1. What is the one-sample t-test and when should I use it?
The one-sample t-test checks whether the mean of a single group of measurements is significantly different from a specific numeric target value — called the hypothesised mean (μ₀). You choose μ₀ based on a known population standard, a manufacturer's claim, or a previously published value.
Use it when you have one group of continuous, independently collected measurements and want to know whether the group average matches an expected benchmark. For example: "Do our patients' blood pressure readings match the healthy population average of 120 mmHg?"
Q2. What is a p-value and how do I interpret it here?
The p-value is the probability of observing a t-statistic as extreme as yours — or more extreme — if the null hypothesis were actually true. It is NOT the probability that the null hypothesis is true.
A p-value of 0.03 means there is a 3% chance of seeing a result this large purely by chance, assuming no real difference exists. If p < α (e.g., p < 0.05), we reject H₀ and say the result is statistically significant. If p ≥ α, we do not have enough evidence to reject H₀.
Q3. Does statistical significance equal practical importance?
No — and this is one of the most common misunderstandings in statistics. With a very large sample size, even a trivially small difference (e.g., mean differs from μ₀ by 0.001 units) can produce p < 0.05. Statistical significance tells you the result is unlikely due to chance; it does NOT tell you whether the difference matters in practice.
Always report the effect size (Cohen's d) alongside the p-value. A large d with a small p indicates both statistical significance AND practical importance. A tiny d with a small p means the difference is real but may be negligible in real-world terms.
Q4. What is Cohen's d and how do I interpret it?
Cohen's d measures the size of the difference between your sample mean and μ₀, expressed in standard deviation units. It is computed as: d = (x̄ − μ₀) / s.
Interpretation benchmarks (Cohen, 1988): d = 0.20 is small (noticeable to careful observers); d = 0.50 is medium (visible to a trained eye); d = 0.80 is large (clearly obvious). Values above 1.20 represent very large effects that are immediately apparent. Sawilowsky (2009) added benchmarks for d ≥ 2.0 as "huge."
Q5. What assumptions must be met, and what if they are violated?
The one-sample t-test requires: (1) the dependent variable is continuous, (2) observations are independent of each other (not paired or clustered), and (3) the data come from an approximately normally distributed population.
The normality assumption matters most for small samples (n < 30). For larger samples, the Central Limit Theorem ensures the sampling distribution of the mean is approximately normal even if the raw data are not. If your data are strongly non-normal and your sample is small, use the Wilcoxon Signed-Rank Test (non-parametric alternative). The Shapiro-Wilk result shown by this calculator gives a formal normality check.
Q6. How large a sample do I need?
It depends on the effect size you expect and the power you need. As a practical guide: to detect a medium effect (d = 0.5) with 80% power at α = 0.05 (two-tailed), you need approximately 34 observations. For a small effect (d = 0.2), you need around 198. For a large effect (d = 0.8), just 15 observations may suffice.
With very small samples (n < 10), even genuine large effects may fail to reach significance. Always perform a power analysis before collecting data.
Q7. One-tailed vs. two-tailed: which should I choose?
A two-tailed test detects differences in either direction (mean is higher or lower than μ₀). A one-tailed test is more powerful but only detects a difference in one pre-specified direction.
Use two-tailed by default unless you have a strong theoretical reason — stated before collecting data — to expect the effect in one direction only. Switching to one-tailed after seeing the data to achieve significance is a form of p-hacking and is not acceptable in research.
Q8. How do I report these results in APA 7th edition format?
The required elements are: test statistic, degrees of freedom, p-value, effect size, and confidence interval. Example format:
t(19) = 2.34, p = .031, d = 0.52, 95% CI [0.8, 4.6]
Rules: write "p < .001" (not "p = .000") for very small p-values; italicise all statistical symbols; always include effect size and CI; state whether the test was one- or two-tailed. See the five auto-filled reporting templates in the Interpretation section above after running the analysis.
Q9. Can I use this calculator for published research or a university assignment?
This tool is designed for educational use and exploratory analysis. The calculations use validated statistical formulas and match results from R, SPSS, and Python. For peer-reviewed publications or formal academic submissions, we recommend verifying critical results with professional statistical software.
To cite this tool: STATS UNLOCK. (2025). One-sample t-test calculator. Retrieved from https://statsunlock.com/calculators/one-sample-t-test-calculator/
Q10. My result is not significant. Does that mean my hypothesis is wrong?
No. A non-significant result (p ≥ α) does not prove the null hypothesis is true — it simply means the data do not provide sufficient evidence to reject it. This could be due to low statistical power from a small sample, high variability in the data, or a real effect that is smaller than your study was designed to detect.
Always check your sample size and the confidence interval. If the CI includes a range of values that would be practically important, you should run a power analysis and consider collecting more data before drawing strong conclusions.
📚 References
The following references support the statistical methods used in this one-sample t-test calculator, covering effect size interpretation, p-value reporting, and best practices in hypothesis testing and data analysis.
- Student [Gosset, W. S.]. (1908). The probable error of a mean. Biometrika, 6(1), 1–25. https://doi.org/10.1093/biomet/6.1.1
- Cohen, J. (1988). Statistical power analysis for the behavioral sciences (2nd ed.). Lawrence Erlbaum Associates.
- Field, A. (2018). Discovering statistics using IBM SPSS statistics (5th ed.). SAGE Publications. https://doi.org/10.4135/9781526419361
- Gravetter, F. J., & Wallnau, L. B. (2017). Statistics for the behavioral sciences (10th ed.). Cengage Learning.
- American Psychological Association. (2020). Publication manual of the American Psychological Association (7th ed.). APA. https://doi.org/10.1037/0000165-000
- Royston, P. (1992). Approximating the Shapiro-Wilk W-test for non-normality. Statistics and Computing, 2(3), 117–119. https://doi.org/10.1007/BF01891203
- Lakens, D. (2013). Calculating and reporting effect sizes to facilitate cumulative science: A practical primer for t-tests and ANOVAs. Frontiers in Psychology, 4, 863. https://doi.org/10.3389/fpsyg.2013.00863
- Sawilowsky, S. S. (2009). New effect size rules of thumb. Journal of Modern Applied Statistical Methods, 8(2), 597–599. https://doi.org/10.22237/jmasm/1257035100
- Cumming, G. (2014). The new statistics: Why and how. Psychological Science, 25(1), 7–29. https://doi.org/10.1177/0956797613504966
- Sullivan, G. M., & Feinn, R. (2012). Using effect size — or why the p value is not enough. Journal of Graduate Medical Education, 4(3), 279–282. https://doi.org/10.4300/JGME-D-12-00156.1
- Wasserstein, R. L., & Lazar, N. A. (2016). The ASA statement on p-values: Context, process, and purpose. The American Statistician, 70(2), 129–133. https://doi.org/10.1080/00031305.2016.1154108
- Howell, D. C. (2013). Statistical methods for psychology (8th ed.). Cengage Learning.
- Keselman, H. J., Huberty, C. J., Lix, L. M., Olejnik, S., Cribbie, R. A., Donahue, B., & Levin, J. R. (1998). Statistical practices of educational researchers. Review of Educational Research, 68(3), 350–386. https://doi.org/10.3102/00346543068003350
- R Core Team. (2024). R: A language and environment for statistical computing. R Foundation for Statistical Computing. https://www.R-project.org/
- NIST/SEMATECH. (2013). e-Handbook of statistical methods. National Institute of Standards and Technology. https://www.itl.nist.gov/div898/handbook/


