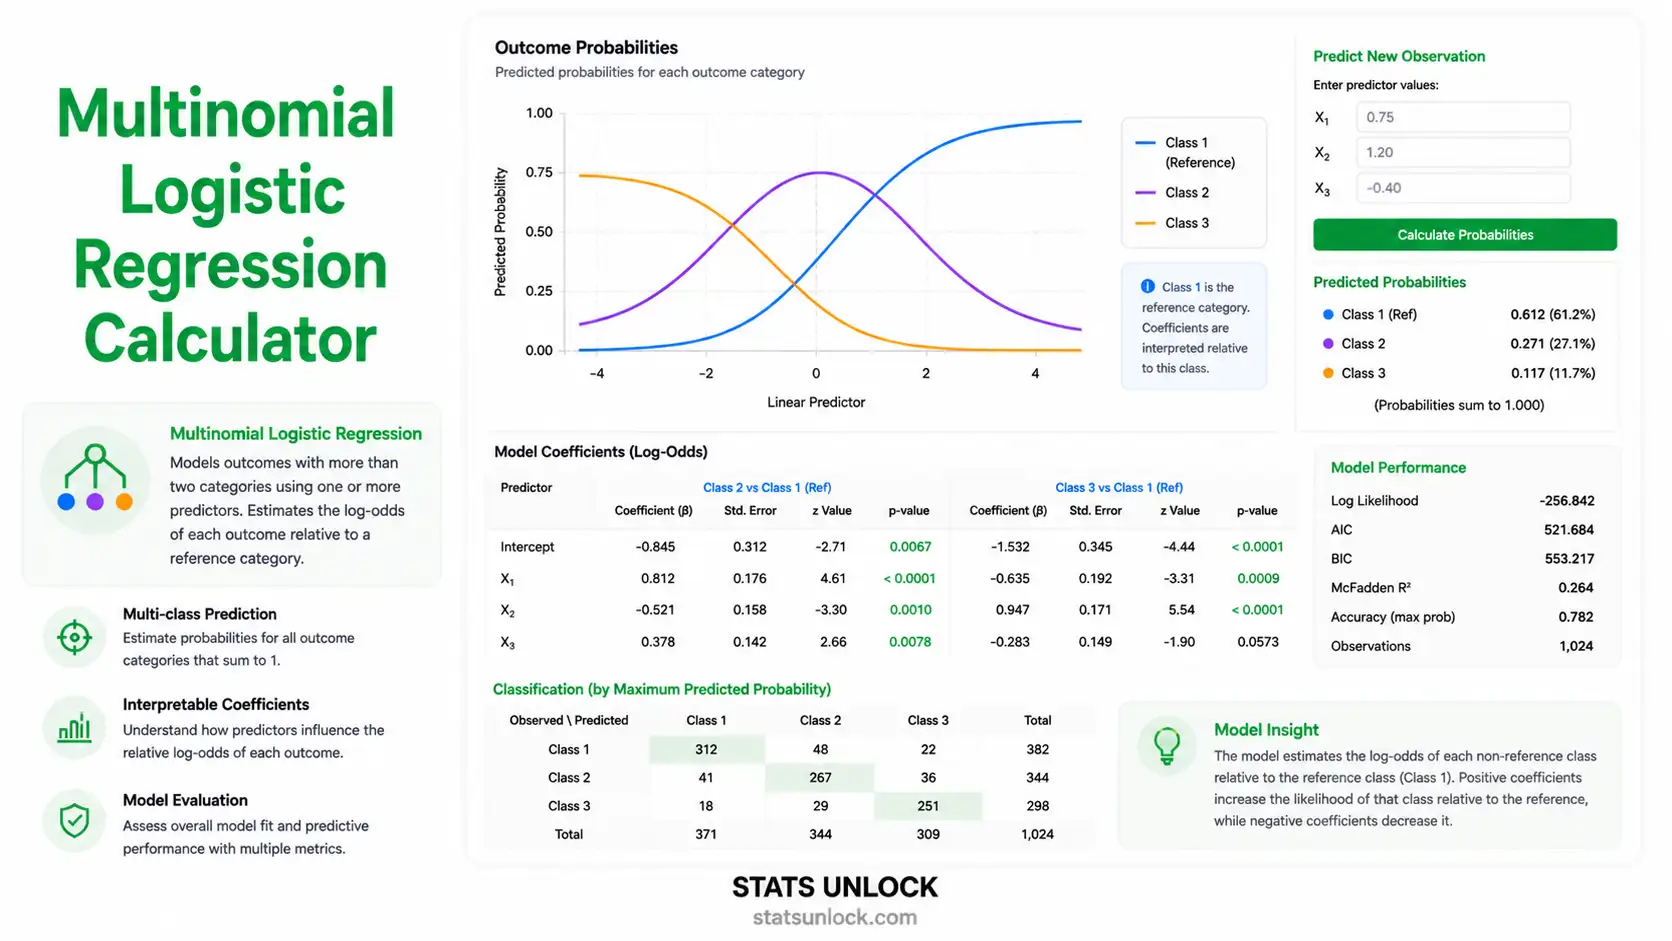
Multinomial Logistic Regression Calculator
Free online generalized linear model (GLM) for multi-class outcomes (3+ unordered categories). Computes coefficients, odds ratios, p-values, log-likelihood, AIC/BIC, McFadden R², confusion matrix, and APA-format results — with colorful publication-quality charts.
📊 1. Enter Your Data
⚙️ 2. Configure the Model
🧠 4. Plain-Language Interpretation
Subsection 1 — Detailed Interpretation Results
Subsection 2 — How to Write Your Results in Research
Five publication-ready reporting templates, automatically filled with your model statistics. Copy the one that matches your target outlet.
🏁 5. Detailed Conclusion
Run the analysis to generate a detailed, contextual conclusion summarising your multinomial logistic regression results, their substantive meaning, and recommended next steps.
📌 6. When to Use Multinomial Logistic Regression
This free multinomial logistic regression calculator is designed for researchers, students, and analysts who need to model an unordered categorical outcome with three or more categories. The tool implements the standard reference-category logit formulation of the generalized linear model with a multinomial response.
Use this test when:
- Your outcome variable is nominal with 3 or more unordered categories (e.g., voter choice, brand preference, transport mode, diagnostic category).
- Your predictor(s) can be continuous, categorical, or a mix.
- Observations are independent (no clustering or repeated measures).
- Sample size is adequate (at least 10 events per predictor per outcome category).
- Multicollinearity among predictors is acceptable (VIF < 5–10).
Real-world examples:
- Political science: Predicting party vote (Party A / B / C) from age, income, and education.
- Marketing: Predicting brand choice (Brand 1 / 2 / 3 / 4) from advertising exposure and spend.
- Medicine: Predicting risk level (Low / Medium / High — when treated as nominal) from biomarkers.
- Transportation: Predicting commute mode (car / bike / transit) from distance and income.
Decision tree — pick the right model:
🔬 7. Technical Notes — Formulas & Estimation
Model specification (reference-category logit):
log( P(Y = k | X) / P(Y = J | X) ) = βk0 + βk1·X1 + … + βkp·Xp
where k = 1, 2, …, J−1 (non-reference categories) and J is the reference category.
Predicted probabilities:
P(Y = k | X) = exp(ηk) / [1 + Σj=1..J−1 exp(ηj)] for non-reference k; reference category gets 1 / [1 + Σ exp(ηj)]
Estimation: Maximum likelihood via Iteratively Reweighted Least Squares (IRLS). The log-likelihood is:
ℓ(β) = Σi=1..n Σk=1..J yik · log( P(Yi = k | Xi) )
Goodness of fit:
- AIC = −2·ℓ(β̂) + 2·k
- BIC = −2·ℓ(β̂) + k·log(n)
- McFadden R² = 1 − (ℓfull / ℓnull)
- Cox-Snell R² = 1 − exp(2·(ℓnull − ℓfull)/n)
- Nagelkerke R² = Cox-Snell R² / (1 − exp(2·ℓnull/n))
- Likelihood Ratio χ² = 2·(ℓfull − ℓnull)
Where: n = sample size, k = number of estimated parameters, J = number of outcome categories, yik = 1 if observation i belongs to category k, else 0.
📖 8. How to Use This Multinomial Logistic Regression Calculator
- STEP 1 — Enter Your Data: Use one of the three tabs. The "Type" tab lets you paste comma-separated predictor values for each outcome category (e.g.,
52, 48, 55, 61, 47). Upload a CSV/Excel file in the "Upload" tab, or build a small dataset by hand in "Manual Entry". - STEP 2 — Choose a Sample Dataset: Five built-in datasets cover voter choice, brand preference, education, diagnosis, and transport mode.
- STEP 3 — Configure the Model: Pick the significance level (α = 0.05 is standard), set the reference category, and adjust IRLS iterations and tolerance only if convergence is poor.
- STEP 4 — Run the Analysis: Click the green button. Results render below in under a second.
- STEP 5 — Read the Summary Cards: Top-row tiles show model χ², overall p-value, McFadden R², AIC, and accuracy. Green = significant, amber = borderline, red = not significant.
- STEP 6 — Read the Full Tables: The coefficient table lists B, SE, Wald z, p, OR, and 95% CI for each predictor in each non-reference category. The fit table lists log-likelihood, AIC, BIC, pseudo R²s, and the LR test. The classification table reports accuracy, per-class precision/recall/F1, and the confusion matrix.
- STEP 7 — Examine the Four Visualizations: (1) Probability curves by category, (2) confusion-matrix heatmap, (3) odds ratios with CIs, (4) class distribution + density.
- STEP 8 — Check Assumptions: The assumption panel uses green/amber/red badges for sample size, IIA proxy, multicollinearity, and outcome balance.
- STEP 9 — Read the Interpretation: Subsection 1 gives 5 plain-language paragraphs; Subsection 2 gives 5 publication-ready writing templates.
- STEP 10 — Export Your Results: Download as a plain-text Doc (great for note-taking) or as a print-ready PDF (great for inclusion in dissertations or reports).
❓ 9. Frequently Asked Questions
Q1. What is multinomial logistic regression and when should I use it?
Multinomial logistic regression is a generalized linear model (GLM) that predicts an unordered categorical outcome with three or more categories from one or more predictors. Use it when your dependent variable is nominal with 3+ classes (e.g., voter choice among three parties, customer brand preference among four brands) and your predictors are continuous, categorical, or a mix. It generalises binary logistic regression by fitting J−1 simultaneous logits, each comparing a non-reference category to the reference category.
Q2. What is a p-value, and how do I interpret it for multinomial logistic regression?
The p-value is the probability of observing your test statistic (or one more extreme) if the null hypothesis were true. For multinomial logistic regression there are two p-values to read: an overall model p-value from the likelihood ratio χ² test, and individual coefficient p-values from each Wald z-test. A coefficient p-value of 0.03 means there is a 3% chance of seeing this slope by chance if the predictor truly had no effect on that category-vs-reference contrast.
Q3. What does statistical significance mean — and does it equal practical importance?
Statistical significance (p < α) tells you the effect is unlikely to be zero. Practical importance is about magnitude: how much do the odds change? With large samples, multinomial logistic regression can flag tiny odds ratios (e.g., OR = 1.05) as significant. Always read odds ratios alongside p-values, and translate them into real-world meaning: "doubling income multiplies the odds of choosing Brand B vs. Brand A by 1.4×."
Q4. What is the odds ratio and how do I interpret it in multinomial logistic regression?
The odds ratio (OR = exp(β)) is the multiplicative change in the odds of being in category k versus the reference category for a one-unit increase in the predictor. OR > 1 means higher odds of k versus reference; OR < 1 means lower odds; OR = 1 means no effect. Always report the 95% confidence interval — if it crosses 1, the effect is not statistically significant at α = 0.05.
Q5. What assumptions does multinomial logistic regression require?
The main assumptions are: (1) Independence of observations; (2) Linearity of continuous predictors with the log-odds; (3) No severe multicollinearity (VIF < 5–10); (4) Independence of Irrelevant Alternatives (IIA) — adding/removing a category should not change relative odds among the rest; (5) Adequate sample size (≥10 events per predictor per category). If IIA is violated, consider nested logit, multinomial probit, or generalized extreme value models.
Q6. How large a sample do I need for multinomial logistic regression?
The standard rule is 10 events per variable per category (EPV ≥ 10). For 3 outcome categories and 4 predictors you need at least 120 cases distributed across categories (at least ≥30 in the smallest). Sparse categories cause convergence failures and inflated standard errors. If your smallest category has fewer than 25 cases, consider collapsing categories or switching to penalised methods (Firth, ridge multinomial).
Q7. How is multinomial logistic regression different from ordinal logistic regression?
Multinomial logistic regression treats categories as unordered — voter choice, brand preference, transport mode. Ordinal logistic regression assumes categories are ordered (e.g., low / medium / high) and that predictor effects are constant across category thresholds (the proportional-odds assumption). Use ordinal when ordering matters and proportional-odds holds; use multinomial when ordering is meaningless or proportional-odds fails.
Q8. How do I report multinomial logistic regression results in APA 7th edition?
Report the overall model first: χ²(df) = ___, p ___, McFadden R² = ___, AIC = ___, n = ___. Then for each predictor and each non-reference category report: B = ___, SE = ___, Wald z = ___, p = ___, OR = ___, 95% CI [___, ___]. Always state the reference category explicitly. See Subsection 2 above for five fully filled-in reporting templates including thesis, plain-language, abstract, and pre-registration formats.
Q9. Can I use this calculator for my published research or thesis?
This free multinomial logistic regression calculator is designed for educational use, exploratory analysis, and result verification. For peer-reviewed publication, also reproduce results in established software (R nnet::multinom, Python statsmodels.MNLogit, Stata mlogit, SPSS NOMREG) and cite this tool as: STATS UNLOCK. (2025). Multinomial logistic regression calculator. Retrieved from https://statsunlock.com.
Q10. What if my model does not converge or the results look odd?
Convergence failures usually indicate (a) complete or quasi-complete separation, (b) sparse categories, (c) severe multicollinearity, or (d) too few iterations. Solutions: collapse small categories, drop redundant predictors, raise the iteration cap to 200+, tighten the tolerance, standardise predictors, or fit a penalised multinomial (Firth's, Lasso). A non-significant model (p > α) does not prove the null — power may simply be inadequate.
📚 10. References
The methodology, formulas, and reporting conventions for this multinomial logistic regression calculator draw on standard sources for generalized linear models (GLMs), maximum-likelihood estimation, and multi-class classification. Citations follow APA 7th edition.
- Agresti, A. (2013). Categorical Data Analysis (3rd ed.). Wiley. https://www.wiley.com/en-us/Categorical+Data+Analysis%2C+3rd+Edition-p-9780470463635
- Hosmer, D. W., Lemeshow, S., & Sturdivant, R. X. (2013). Applied Logistic Regression (3rd ed.). Wiley. https://doi.org/10.1002/9781118548387
- McCullagh, P., & Nelder, J. A. (1989). Generalized Linear Models (2nd ed.). Chapman and Hall. https://doi.org/10.1201/9780203753736
- McFadden, D. (1974). Conditional logit analysis of qualitative choice behaviour. In P. Zarembka (Ed.), Frontiers in Econometrics (pp. 105–142). Academic Press. https://eml.berkeley.edu/reprints/mcfadden/zarembka.pdf
- Long, J. S. (1997). Regression Models for Categorical and Limited Dependent Variables. Sage. https://us.sagepub.com/en-us/nam/regression-models-for-categorical-and-limited-dependent-variables/book6071
- Menard, S. (2010). Logistic Regression: From Introductory to Advanced Concepts and Applications. Sage. https://doi.org/10.4135/9781483348964
- Allison, P. D. (2012). Logistic Regression Using SAS: Theory and Application (2nd ed.). SAS Institute. https://www.sas.com/store/prodBK_65840_en.html
- Hausman, J., & McFadden, D. (1984). Specification tests for the multinomial logit model. Econometrica, 52(5), 1219–1240. https://doi.org/10.2307/1910997
- Tabachnick, B. G., & Fidell, L. S. (2019). Using Multivariate Statistics (7th ed.). Pearson. https://www.pearson.com/en-us/subject-catalog/p/using-multivariate-statistics/P200000003097
- Field, A., Miles, J., & Field, Z. (2012). Discovering Statistics Using R. Sage. https://www.discoveringstatistics.com/books/dsur/
- Venables, W. N., & Ripley, B. D. (2002). Modern Applied Statistics with S (4th ed.). Springer. https://doi.org/10.1007/978-0-387-21706-2
- Faraway, J. J. (2016). Extending the Linear Model with R (2nd ed.). CRC Press. https://doi.org/10.1201/9781315382722
- Cohen, J., Cohen, P., West, S. G., & Aiken, L. S. (2003). Applied Multiple Regression/Correlation Analysis for the Behavioral Sciences (3rd ed.). Routledge. https://doi.org/10.4324/9780203774441
- R Core Team. (2024). R: A language and environment for statistical computing. R Foundation. https://www.R-project.org/
- American Psychological Association. (2020). Publication Manual of the American Psychological Association (7th ed.). APA. https://doi.org/10.1037/0000165-000


