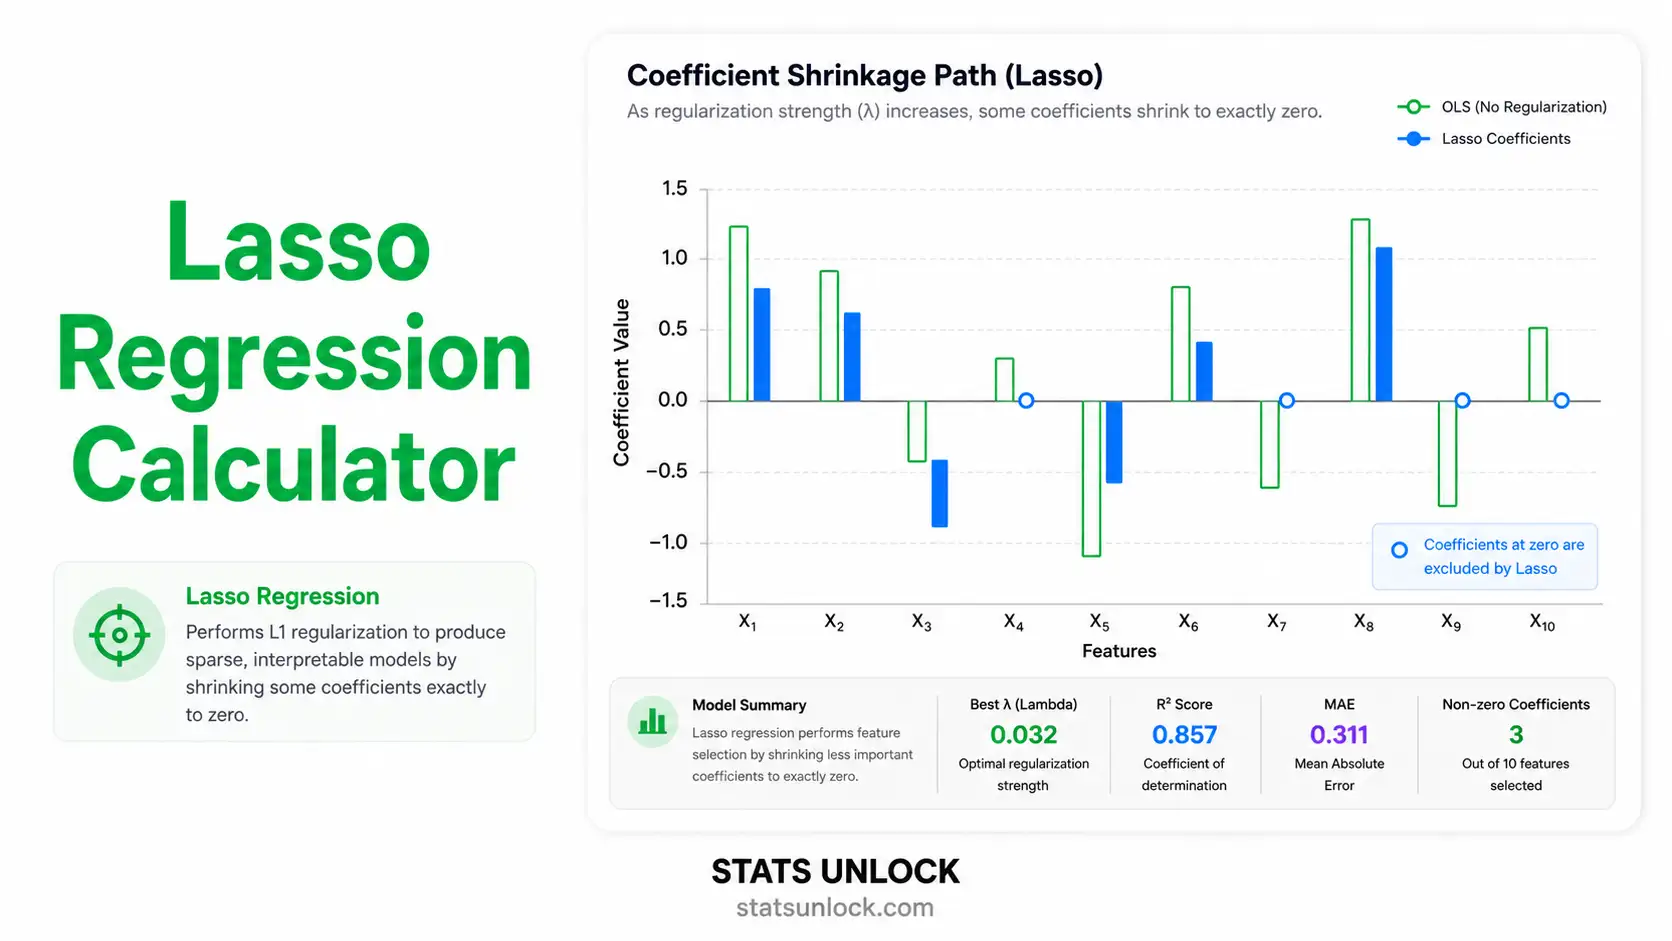
Lasso Regression Calculator
Free online lasso regression tool with L1 penalty, cross-validated lambda tuning, sparse feature selection, coefficient path visualization, and ready-to-paste APA-format results. Add up to 10 predictors, run the analysis, and download a publication-ready report.
Paste your data as comma-separated numbers in the textarea on the Paste / Type Data tab. Each predictor and the outcome must have the same number of values. Example for 6 observations:
Outcome (Y):       52, 48, 55, 61, 47, 50
Predictor X1:      1.2, 0.9, 1.5, 1.8, 0.8, 1.1
Predictor X2:      28, 31, 26, 24, 32, 29
Predictor X3:       7,  6,  8,  9,  6,  7
📐 Technical Notes — Formulas & Computation
Lasso Objective Function
β̂Lasso = argminβ { (1/2n) · Σ (yi − β₀ − Σ xijβj)² + λ · Σ |βj| }
Where:
• n = number of observations
• yi = observed outcome for observation i
• xij = standardized value of predictor j for observation i
• β₀ = intercept (not penalized)
• βj = coefficient for predictor j
• λ ≥ 0 = regularization (penalty) strength
• Σ |βj| = L1 norm — the sum of absolute coefficient values
Coordinate Descent Update
βj ← S(zj, λ) / Σ xij²
Where S(z, λ) is the soft-threshold operator: S(z, λ) = sign(z) · max(|z| − λ, 0). This produces exact zeros — the source of Lasso's feature-selection property. Predictors with weak signal are zeroed out as λ grows.
Cross-Validation
The data are split into k folds. For each candidate λ on a log-spaced grid, the model is fit on k−1 folds and the mean squared error is computed on the held-out fold. The lambda.min rule picks the λ that minimizes mean CV error; the lambda.1se rule picks the largest λ whose CV error is within one standard error of the minimum (a more parsimonious choice).
📌 When to Use Lasso Regression
This free lasso regression calculator is designed for researchers, students, and analysts who need a sparse, interpretable linear model with automatic variable selection. Use Lasso when you want the model to zero out unimportant predictors and keep only those that genuinely contribute to the outcome.
Use Lasso when …
- You have many predictors and suspect only a subset are truly important.
- You need a sparse, interpretable model (a clear list of "kept" variables).
- The number of predictors is large relative to the sample size, including p > n.
- You want feature selection and coefficient estimation done in one step.
- OLS is overfitting because of multicollinearity or noisy predictors.
Don't use Lasso when …
- Predictors are highly grouped/correlated and you need to keep all of them — use Elastic Net.
- You need stable inference (p-values, CIs from standard theory) — Lasso CIs require special methods (post-selection inference).
- The outcome is binary (use logistic Lasso) or count (use Poisson Lasso).
- The relationship between X and Y is strongly non-linear without basis expansion.
Real-world examples
📚 How to Use This Lasso Regression Calculator
52, 48, 55, 61, 47 (5 observations).Q1. What is Lasso regression and when should I use it?
Lasso (Least Absolute Shrinkage and Selection Operator) is a penalized linear regression that adds an L1 penalty (λ × Σ|β|) to ordinary least squares. It shrinks coefficients toward zero and sets some exactly to zero — performing automatic variable selection.
Use it when you have many predictors, suspect only a subset matters, or want a sparse, interpretable model. Common in genomics, marketing-mix modeling, and any setting where p (predictors) is large relative to n (observations).
Q2. What does lambda (λ) mean in Lasso regression?
Lambda is the regularization strength — the weight on the L1 penalty. λ = 0 reproduces ordinary least squares with no shrinkage. As λ grows, more coefficients are pulled to zero and the model becomes more sparse.
The optimal lambda is usually chosen by cross-validation. lambda.min minimizes mean CV error; lambda.1se picks the largest λ whose CV error is within one standard error of the minimum, giving a more parsimonious model.
Q3. What is the difference between Lasso, Ridge, and Elastic Net?
Ridge (L2) uses Σβ² as the penalty — shrinks coefficients smoothly but never to exactly zero.
Lasso (L1) uses Σ|β| — produces exact zeros and performs feature selection.
Elastic Net combines both penalties: α·Σ|β| + (1−α)·Σβ² — handles correlated predictors better than pure Lasso while retaining sparsity.
Q4. How do I choose the best lambda for Lasso?
Use k-fold cross-validation (10-fold is standard). The tool fits the model on k−1 folds and tests on the remaining fold for each candidate λ on a log-spaced grid, then picks the λ that minimizes mean CV error.
For a more conservative model, use the lambda.1se rule, which picks the largest λ within one SE of the minimum — typically 30 % to 60 % fewer non-zero coefficients than lambda.min.
Q5. Why are some Lasso coefficients exactly zero?
The L1 constraint region is a diamond (or hyper-octahedron) with corners at zero on each axis. Optimization solutions tend to land on these corners, which forces some coefficients to be exactly zero. Ridge's L2 region is a sphere with no such corners — it shrinks but never zeroes.
This corner-solution geometry is what makes Lasso a feature-selection method. Selected predictors are the ones whose marginal contribution outweighs the penalty cost.
Q6. What assumptions does Lasso regression require?
Lasso assumes (1) a roughly linear relationship between predictors and outcome; (2) independent observations; (3) standardized predictors so the L1 penalty applies fairly; (4) a continuous outcome — for binary use logistic Lasso, for counts use Poisson Lasso.
Lasso is more robust to multicollinearity than OLS but tends to arbitrarily pick one predictor from a correlated group. If grouping matters, use Elastic Net instead.
Q7. How large a sample do I need?
Lasso can technically handle p > n, but stable estimation needs reasonable signal-to-noise. A practical rule of thumb is at least 10 observations per non-zero coefficient you expect to keep.
For stable cross-validation, use n ≥ 50 with 5- or 10-fold CV. With n < 30 use leave-one-out CV (LOOCV) instead — it has higher variance but uses every observation.
Q8. Can Lasso give me p-values and confidence intervals?
Standard frequentist inference is invalid for Lasso because variable selection is data-driven (the "post-selection inference" problem). The CIs reported by this tool are bootstrap-style approximations and should be interpreted with caution.
For formal p-values use the selectiveInference R package, or cross-check selected predictors with OLS on a held-out sample.
Q9. How do I report Lasso regression in APA format?
Report (1) the optimal lambda and selection rule (e.g., 10-fold CV, lambda.min); (2) standardization status; (3) the number of selected predictors; (4) model R² and RMSE on the training data and a held-out test set if available; (5) a coefficient table for the selected variables.
Step 7 of this tool gives five complete templates — APA, thesis, plain-language, conference abstract, and pre-registration — auto-filled with your current statistics.
Q10. Can I use this calculator for published research?
This tool is designed for educational use, classroom demonstrations, and exploratory analysis. For peer-reviewed publications, verify your results using glmnet (R), scikit-learn (Python), or SAS PROC GLMSELECT.
Cite as: STATS UNLOCK. (2026). Lasso regression calculator. Retrieved from https://statsunlock.com.
The lasso regression calculator above implements methods grounded in the L1 regularization, sparse regression, and cross-validation literature. The references below are the foundational works for Lasso theory and practice.
- Tibshirani, R. (1996). Regression shrinkage and selection via the lasso. Journal of the Royal Statistical Society: Series B, 58(1), 267–288. https://doi.org/10.1111/j.2517-6161.1996.tb02080.x
- Friedman, J., Hastie, T., & Tibshirani, R. (2010). Regularization paths for generalized linear models via coordinate descent. Journal of Statistical Software, 33(1), 1–22. https://doi.org/10.18637/jss.v033.i01
- Hastie, T., Tibshirani, R., & Friedman, J. (2009). The elements of statistical learning (2nd ed.). Springer. https://doi.org/10.1007/978-0-387-84858-7
- Hastie, T., Tibshirani, R., & Wainwright, M. (2015). Statistical learning with sparsity: The lasso and generalizations. CRC Press. https://doi.org/10.1201/b18401
- Zou, H., & Hastie, T. (2005). Regularization and variable selection via the elastic net. Journal of the Royal Statistical Society: Series B, 67(2), 301–320. https://doi.org/10.1111/j.1467-9868.2005.00503.x
- Efron, B., Hastie, T., Johnstone, I., & Tibshirani, R. (2004). Least angle regression. The Annals of Statistics, 32(2), 407–499. https://doi.org/10.1214/009053604000000067
- Meinshausen, N., & Bühlmann, P. (2010). Stability selection. Journal of the Royal Statistical Society: Series B, 72(4), 417–473. https://doi.org/10.1111/j.1467-9868.2010.00740.x
- Lockhart, R., Taylor, J., Tibshirani, R. J., & Tibshirani, R. (2014). A significance test for the lasso. The Annals of Statistics, 42(2), 413–468. https://doi.org/10.1214/13-AOS1175
- Bühlmann, P., & van de Geer, S. (2011). Statistics for high-dimensional data: Methods, theory and applications. Springer. https://doi.org/10.1007/978-3-642-20192-9
- Tibshirani, R. (2011). Regression shrinkage and selection via the lasso: A retrospective. Journal of the Royal Statistical Society: Series B, 73(3), 273–282. https://doi.org/10.1111/j.1467-9868.2011.00771.x
- James, G., Witten, D., Hastie, T., & Tibshirani, R. (2021). An introduction to statistical learning (2nd ed.). Springer. https://doi.org/10.1007/978-1-0716-1418-1
- Fan, J., & Li, R. (2001). Variable selection via nonconcave penalized likelihood and its oracle properties. Journal of the American Statistical Association, 96(456), 1348–1360. https://doi.org/10.1198/016214501753382273
- Zhao, P., & Yu, B. (2006). On model selection consistency of lasso. Journal of Machine Learning Research, 7, 2541–2563.
- R Core Team. (2024). R: A language and environment for statistical computing. R Foundation for Statistical Computing. https://www.R-project.org/
- Pedregosa, F., et al. (2011). Scikit-learn: Machine learning in Python. Journal of Machine Learning Research, 12, 2825–2830.


