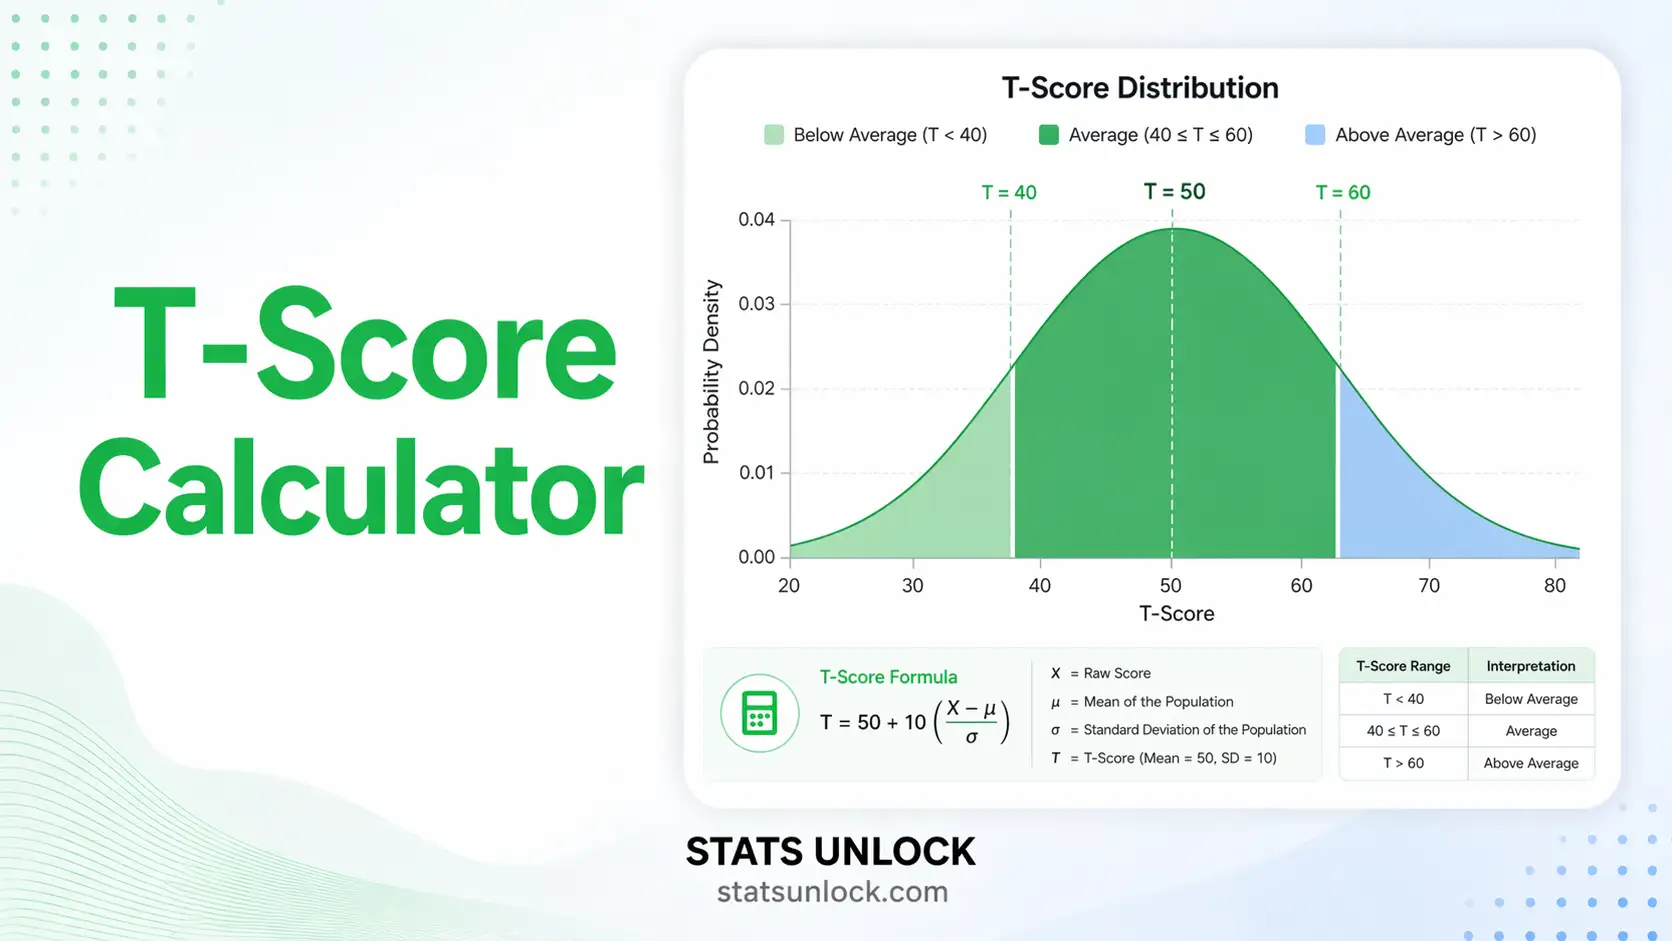
T-score: T = 50 + 10 × Z = 50 + 10 × [(X − μ) / σ]
Inverse (raw from T): X = μ + σ × [(T − 50) / 10]
Where: X = raw score, μ = reference mean, σ = reference standard deviation. The T-score distribution has mean = 50 and SD = 10 by definition. T-scores are always positive for values within ±5 SD of the mean (T range: 0–100 for ±5 SD).
Percentile estimation (assuming normality): uses the cumulative normal distribution Φ(Z) where Z = (T − 50) / 10.
⬇️ Download Results
When to Use T-Scores
Use T-scores when you need to express a raw score in relation to a reference group using a scale with mean = 50 and SD = 10.
✅ Use T-scores when:
Comparing scores across different tests
Reporting psychological assessment results
Educational test norming
Physical fitness evaluation
Avoiding negative numbers (vs Z-scores)
Presenting to non-statistical audiences
❌ Do not use when:
Testing group mean differences (use t-test)
Reference mean/SD are unknown
Data is nominal/ordinal only
Comparing different constructs without a common norm
Decision rule: If you need a score that non-statisticians can interpret easily without negative numbers, choose T-scores over Z-scores. If you need inferential testing, use a t-test instead.
How to Use This T-Score Calculator
1
Enter your raw scores — type, paste, or upload a CSV/Excel file. The tool accepts comma- or newline-separated numbers.
2
Set your reference mean and SD — use your normative population values. Leave blank to compute from the entered data.
3
Optional: enter a target raw score — the tool highlights its T-score on the chart.
4
Click "Calculate T-Scores" — instant results including summary statistics, full T-score table, and two charts.
5
Read the interpretation section — dynamic paragraphs explain your results in plain language.
6
Copy APA-format example — pre-filled with your computed values for direct use in reports.
7
Download your report — as a .txt doc, Excel spreadsheet, Word document, or PDF.
8
Check the assumption panel — verify that T-score transformation is appropriate for your data.
9
Use the individual T-scores table — each raw score is paired with its T-score, Z-score, and approximate percentile.
10
Example: Raw score = 85, Mean = 75, SD = 10 → Z = (85−75)/10 = 1.0 → T = 50 + 10(1.0) = 60.
Frequently Asked Questions
What is a T-score in descriptive statistics?
A T-score is a standardized score with a mean of 50 and a standard deviation of 10. It transforms raw scores into a common scale, making it easy to compare individual scores across different datasets or tests without negative numbers.
How do you calculate a T-score from a raw score?
T-score = 50 + 10 × Z-score, where Z-score = (Raw Score − Mean) / SD. Substitute your raw score, reference mean, and SD into this formula to get the T-score instantly.
What is the difference between a T-score and a Z-score?
A Z-score has mean = 0 and SD = 1, and can be negative. A T-score is a rescaled Z-score with mean = 50 and SD = 10, so it is always positive and much easier to communicate to non-statisticians and clients.
What does a T-score of 50 mean?
A T-score of 50 means the raw score is exactly at the population or reference group mean. Scores above 50 are above average; scores below 50 are below average. Each 10-point change equals one standard deviation.
Is a T-score the same as a t-test statistic?
No. A T-score (capital T, descriptive) is a standardized score with mean=50 and SD=10 used in descriptive statistics. A t-statistic (lowercase t, inferential) is calculated in t-tests to compare group means. They are unrelated concepts.
What T-score range is considered average?
T-scores between 40 and 60 are considered average (within one SD of the mean). Scores of 60–70 are above average; 70+ are well above average; below 40 is below average; below 30 is well below average.
How are T-scores used in psychology and education?
T-scores are used in psychological assessments (MMPI, BDI), educational testing, and fitness evaluations to express where an individual falls relative to a normative population. They eliminate confusion about direction that negative Z-scores can cause.
Can I calculate a T-score from a small sample?
Yes, but with caution. Mean and SD estimated from small samples (n < 30) have higher uncertainty, so T-scores are less reliable. Ideally, use published normative values (from large reference populations) rather than your small sample's statistics.
What assumptions does T-score calculation require?
T-score calculation requires knowledge of a reference mean and SD. The formula itself has no normality requirement, but converting T-scores to percentiles assumes approximate normality in the reference population.
How do I convert a T-score back to a raw score?
Raw Score = Mean + SD × ((T-score − 50) / 10). Simply reverse the T-score formula using your reference group's mean and standard deviation.
References
The T-score calculator is grounded in descriptive statistics and standardized score methodology from the following sources:
McCall, W. A. (1922). How to measure in education. Macmillan.
Tabachnick, B. G., & Fidell, L. S. (2019). Using multivariate statistics (7th ed.). Pearson.
American Psychological Association. (2020). Publication manual of the American Psychological Association (7th ed.). APA. https://doi.org/10.1037/0000165-000
Field, A. (2024). Discovering statistics using IBM SPSS statistics (6th ed.). SAGE Publications.
Gravetter, F. J., & Wallnau, L. B. (2021). Statistics for the behavioral sciences (10th ed.). Cengage Learning.
Nunnally, J. C., & Bernstein, I. H. (1994). Psychometric theory (3rd ed.). McGraw-Hill.
Hinkle, D. E., Wiersma, W., & Jurs, S. G. (2003). Applied statistics for the behavioral sciences (5th ed.). Houghton Mifflin.
Butcher, J. N., Graham, J. R., Ben-Porath, Y. S., Tellegen, A., Dahlstrom, W. G., & Kaemmer, B. (2001). MMPI-2: Manual for administration and scoring. University of Minnesota Press.
Anastasi, A., & Urbina, S. (1997). Psychological testing (7th ed.). Prentice Hall.
Streiner, D. L., Norman, G. R., & Cairney, J. (2015). Health measurement scales: A practical guide to their development and use (5th ed.). Oxford University Press. https://doi.org/10.1093/med/9780199685219.001.0001