Mean Squared Error (MSE) Calculator
Enter your actual and predicted values to calculate MSE, RMSE, MAE, and related error metrics instantly — with step-by-step results, charts, and downloadable reports.
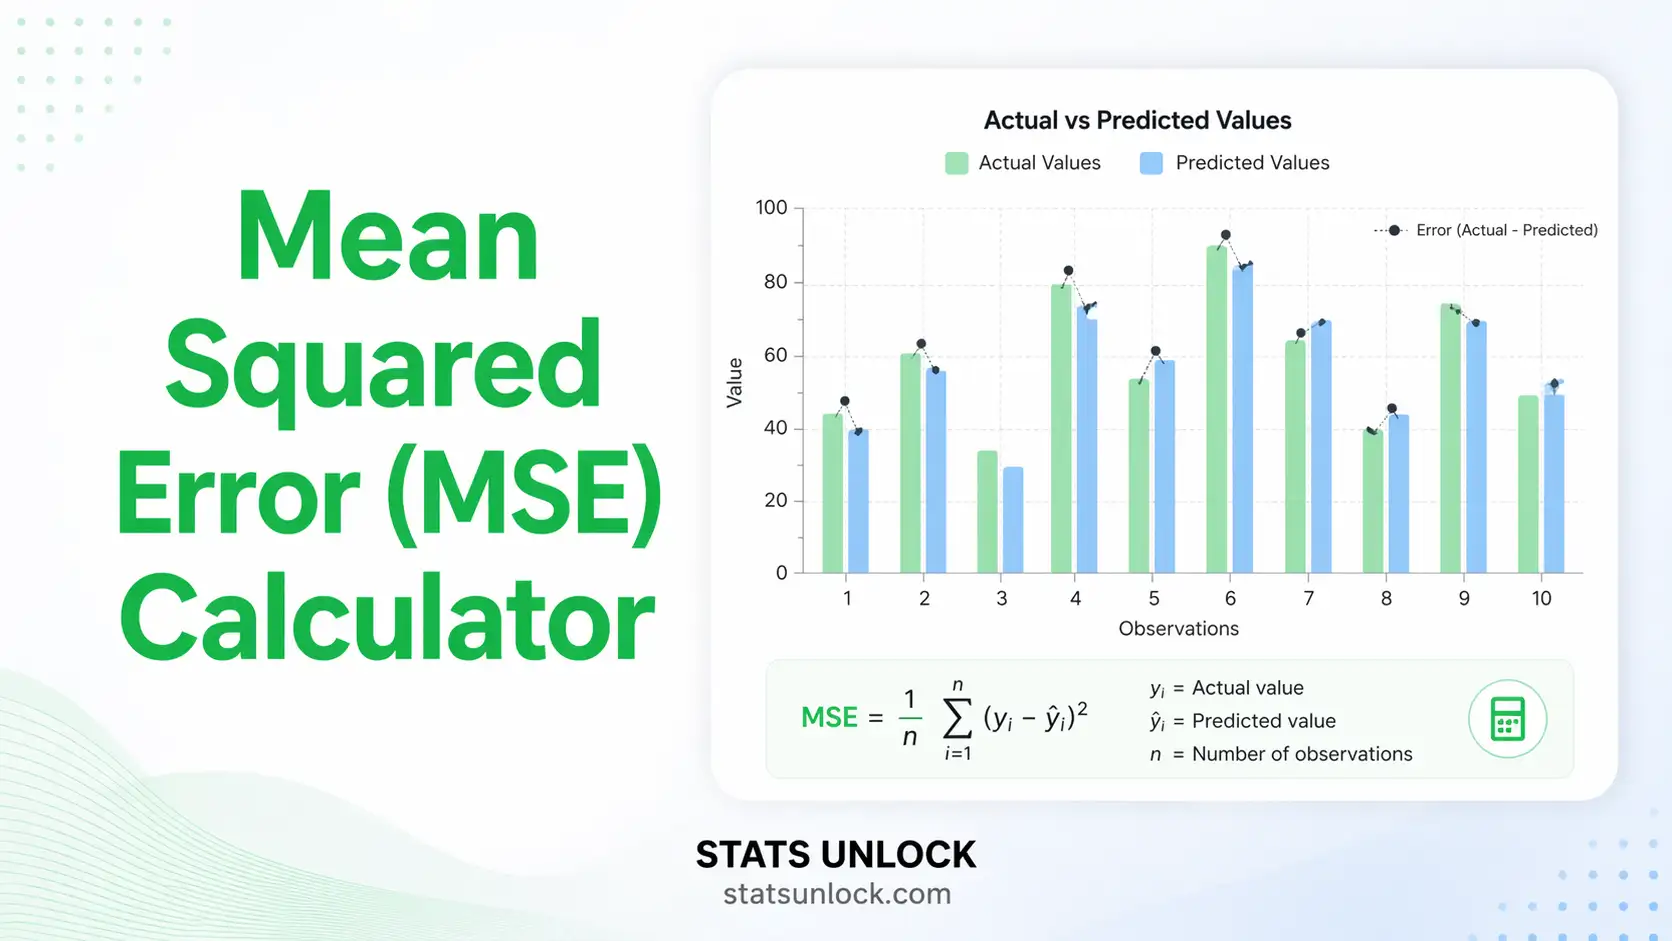
🔢 Technical Notes & Formulas
- n — number of observations
- yᵢ — actual (observed) value for observation i
- ŷᵢ — predicted value for observation i
- (yᵢ − ŷᵢ) — residual (error) for observation i
- Σ — sum over all n observations
Key property: MSE squares each residual before averaging. This means large individual errors are penalised disproportionately compared to MAE. RMSE restores the original unit scale, making it more interpretable than MSE. R² measures the proportion of variance in the actual values explained by the predictions.
The mean squared error calculator is appropriate when you want a regression error metric that penalises large errors more than small ones. Use MSE when:
- ✅ You are evaluating a regression or forecasting model.
- ✅ Large prediction errors are especially costly in your application.
- ✅ You need a differentiable loss function for gradient-based optimisation (e.g., neural networks).
- ✅ You are comparing two or more models trained on the same dataset.
- ✅ You need to compute RMSE by taking the square root of MSE for interpretability.
Decision tree: Do you want equal weight on all errors? → Use MAE. Do you want to penalise large errors more? → Use MSE. Do you need the same units as your data? → Use RMSE (√MSE). Do you want a scale-free metric? → Use NMSE or R².
Choose a sample dataset or enter your own actual and predicted values in the Type tab — one value per line, or comma-separated.
Upload a file (optional): upload a .csv, .xlsx, or .xls file. Select the actual-values column and the predicted-values column from the buttons that appear.
Use the manual table for small datasets: enter pairs of actual and predicted values row by row, then click Apply.
Set the decimal places and normalisation option in the Configuration panel if needed.
Click "Calculate MSE & Error Metrics" to run the analysis. Results appear instantly.
Review the summary cards for key metrics: MSE, RMSE, MAE, and R².
Inspect the results table for all computed statistics, and the charts for a visual breakdown of errors.
Read the interpretation for a plain-English explanation of your MSE result and what it means for your model.
Copy a write-up template (APA, thesis, report, etc.) pre-filled with your computed values.
Export your results using Download Doc, Download Excel, Download Word, or Download PDF for reports or presentations.
Residuals: [−0.5, 0.2, −0.2, −0.6, 0.6] → Squared: [0.25, 0.04, 0.04, 0.36, 0.36]
MSE = (0.25+0.04+0.04+0.36+0.36)/5 = 1.05/5 = 0.21 · RMSE = √0.21 ≈ 0.458
What is Mean Squared Error (MSE)?
How do you calculate MSE step by step?
What is a good MSE value?
What is the difference between MSE and RMSE?
What is the difference between MSE and MAE?
Can MSE be negative?
Is MSE used as a loss function in machine learning?
What does a high MSE mean?
What is Normalised MSE (NMSE)?
When should I use MSE instead of MAE or R²?
The following references support the mean squared error calculator, MSE formula, and related regression error metrics discussed in this tool:
- Willmott, C. J., & Matsuura, K. (2005). Advantages of the mean absolute error (MAE) over the root mean square error (RMSE) in assessing average model performance. Climate Research, 30(1), 79–82. https://doi.org/10.3354/cr030079
- Chai, T., & Draxler, R. R. (2014). Root mean square error (RMSE) or mean absolute error (MAE)?—Arguments against avoiding RMSE in the literature. Geoscientific Model Development, 7(3), 1247–1250. https://doi.org/10.5194/gmd-7-1247-2014
- Hyndman, R. J., & Athanasopoulos, G. (2021). Forecasting: Principles and practice (3rd ed.). OTexts. https://otexts.com/fpp3/
- James, G., Witten, D., Hastie, T., & Tibshirani, R. (2021). An introduction to statistical learning (2nd ed.). Springer. https://www.statlearning.com
- Goodfellow, I., Bengio, Y., & Courville, A. (2016). Deep learning. MIT Press. https://www.deeplearningbook.org
- Hastie, T., Tibshirani, R., & Friedman, J. (2009). The elements of statistical learning (2nd ed.). Springer. https://hastie.su.domains/ElemStatLearn/
- Bishop, C. M. (2006). Pattern recognition and machine learning. Springer.
- Makridakis, S. (1993). Accuracy measures: Theoretical and practical concerns. International Journal of Forecasting, 9(4), 527–529. https://doi.org/10.1016/0169-2070(93)90079-3
- Shcherbakov, M. V., Brebels, A., Shcherbakova, N. L., Tyukov, A. P., Janovsky, T. A., & Kamaev, V. A. (2013). A survey of forecast error measures. World Applied Sciences Journal, 24(24), 171–176.
- Hyndman, R. J., & Koehler, A. B. (2006). Another look at measures of forecast accuracy. International Journal of Forecasting, 22(4), 679–688. https://doi.org/10.1016/j.ijforecast.2006.03.001
- Montgomery, D. C., Peck, E. A., & Vining, G. G. (2021). Introduction to linear regression analysis (6th ed.). Wiley.
- Kvalseth, T. O. (1985). Cautionary note about R². The American Statistician, 39(4), 279–285. https://doi.org/10.2307/2683704


