Standard Error of the Mean Calculator
Free online SEM calculator — compute standard error of the mean, confidence intervals, and full descriptive statistics from your data instantly.
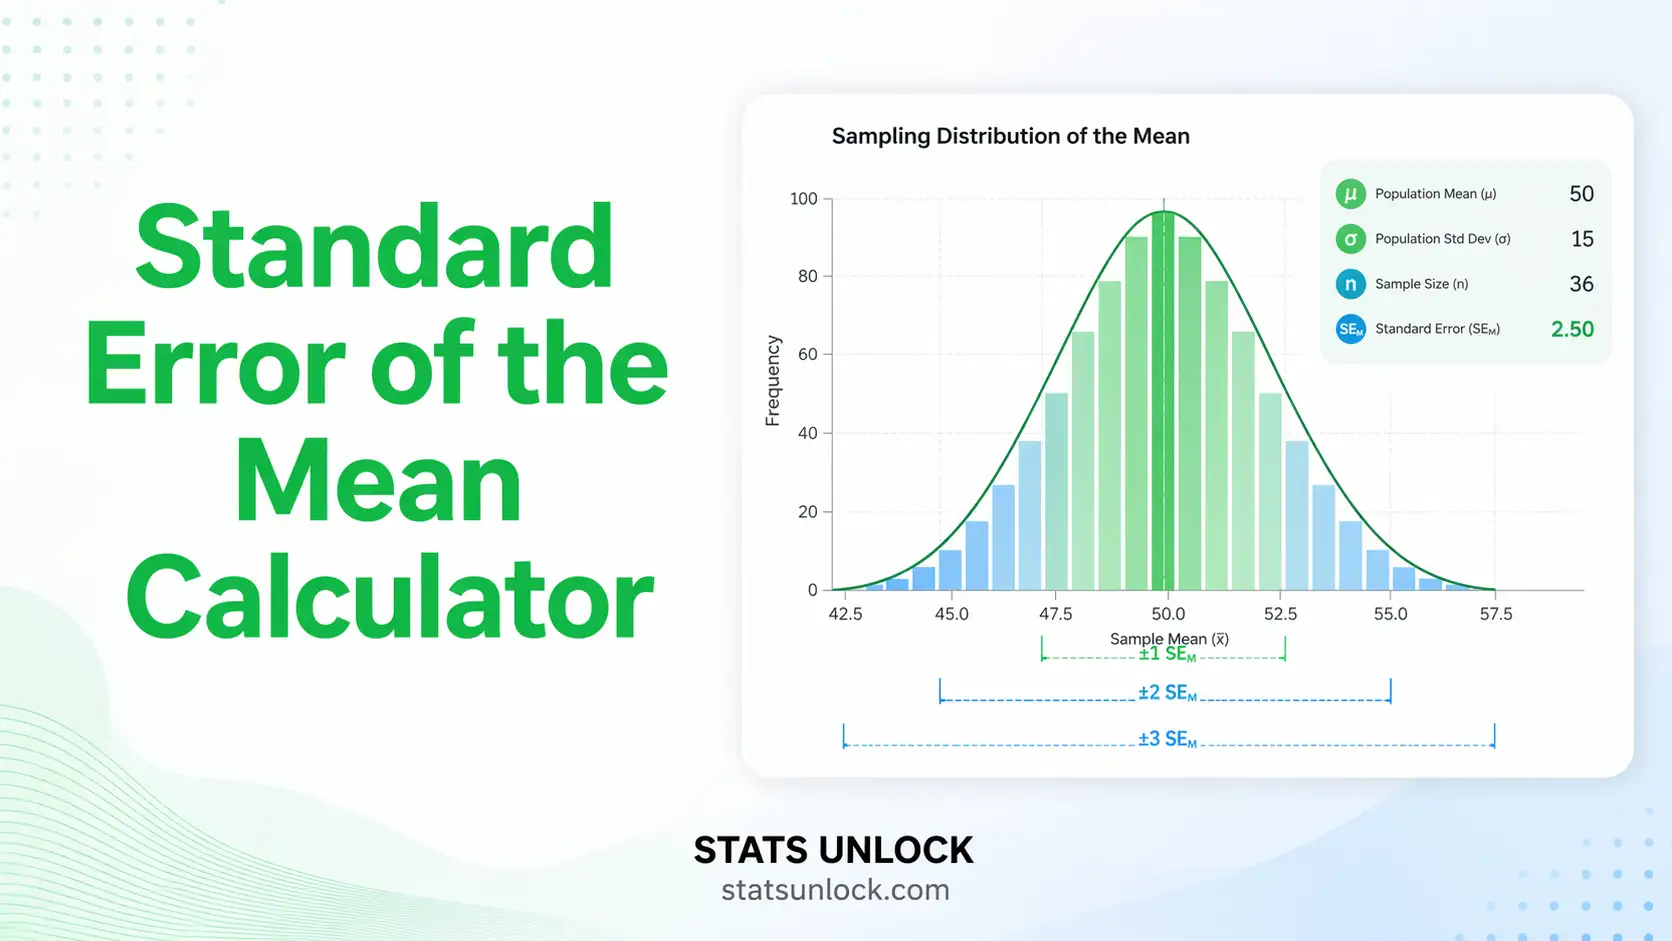
The standard error of the mean (SEM) measures how precisely your sample mean estimates the true population mean. Formula: SEM = SD ÷ √n. A smaller SEM means a more precise estimate. Enter your data below to calculate SEM, confidence intervals, and 20+ descriptive statistics instantly.
Tip: paste from Excel, CSV, or type values separated by commas, spaces, tabs, or new lines.
Select a numeric column:
| Value |
| Statistic | Description | Value |
|---|
Run the analysis above to auto-fill these examples.
Core SEM Formula
- s = sample standard deviation (using Bessel's correction: denominator n−1)
- n = sample size (number of observations)
- √n = square root of sample size
Confidence Interval for the Mean
- x̄ = sample mean
- t*(α/2, n−1) = critical t-value with n−1 degrees of freedom
- α = 1 − confidence level (e.g., α = 0.05 for 95% CI)
One-Sample t-Statistic (if μ₀ specified)
Key Relationships
- SEM decreases as n increases: doubling n reduces SEM by ~29%
- SEM → 0 as n → ∞ (sample mean converges to population mean)
- Coefficient of Variation of the Mean = SEM / |x̄| × 100%
- SD ≠ SEM: SD describes data spread; SEM describes mean precision
- You want to estimate how precisely your sample mean represents the population mean
- You are constructing confidence intervals around a mean
- You are performing a one-sample t-test
- You are reporting error bars in scientific figures (mean ± SEM)
- You are comparing the reliability of means across studies with different sample sizes
SEM vs SD — Quick Decision
📌 Use SD → when describing how spread-out individual measurements are
📌 Use SEM → when describing how precisely you know the mean
- Enter your data — Type, paste, or upload values using the tabs above. Values can be space, comma, tab, or newline separated.
- Or load a sample — Use the "Load sample" dropdown to explore the tool with pre-built datasets before entering your own.
- Choose confidence level — Select 90%, 95% (default), or 99% depending on your research requirements.
- Set decimal places — Choose how many decimal places to display in the output table (3 is standard for most research).
- Optional: enter μ₀ — If you want to test whether your mean differs from a known population value, enter it in the Hypothesis μ₀ field.
- Click "Calculate SEM" — The tool instantly computes SEM, CI, mean, SD, and 20+ additional statistics.
- Read the summary cards — Four key values are highlighted at the top for quick reference.
- Review the interpretation — Plain-language explanations and 5 ready-to-use reporting templates are auto-filled with your results.
- Check assumptions — Review the automated assumption checks to ensure valid inference.
- Export your results — Download as plain text, Excel, Word report, or PDF with a single click.
Worked Example
Data: 12.4, 15.1, 13.8, 14.2, 16.0, 13.5, 14.8, 15.3, 12.9, 14.6
n = 10, Mean = 14.26, SD = 1.101, SEM = 1.101 / √10 = 0.348
95% CI = 14.26 ± (2.262 × 0.348) = [13.472, 15.048]
What is the standard error of the mean (SEM)?
The standard error of the mean (SEM) measures how much the sample mean is expected to vary from the true population mean across repeated samples. It equals the standard deviation divided by the square root of sample size: SEM = SD / √n. A smaller SEM indicates a more precise mean estimate.
How do you calculate the standard error of the mean step by step?
Step 1: Compute the sample mean (sum all values ÷ n). Step 2: Calculate the sample standard deviation (using n−1 in the denominator). Step 3: Divide SD by the square root of n. That's your SEM. This calculator does all three steps automatically.
What is the difference between standard error and standard deviation?
Standard deviation (SD) describes how much individual data points vary around the mean — it's a property of your data. Standard error of the mean (SEM) describes how precisely the sample mean estimates the population mean — it's a property of your estimate. As sample size grows, SEM shrinks, while SD stays approximately constant.
What does a small SEM indicate?
A small SEM means your sample mean is a precise estimate of the true population mean. This typically results from a large sample size or low variability in the underlying data. A small SEM produces narrower confidence intervals, which is generally desirable in research.
How is SEM used in confidence intervals?
A 95% confidence interval for the mean is: Mean ± (t* × SEM), where t* is the critical t-value for your df and confidence level. The SEM directly controls the width of the CI — halving SEM halves the CI width. Our calculator computes CIs automatically for 90%, 95%, and 99% confidence levels.
When should I report SEM vs SD in my paper?
Report SD when describing data variability (how spread out your measurements are). Report SEM when emphasising the precision of your mean estimate — especially in figures with error bars and tables comparing group means. Many journals require you to specify which you are reporting.
Does SEM always decrease with more data?
Yes. Since SEM = SD / √n, adding more observations always reduces SEM (assuming SD stays similar). Doubling sample size reduces SEM by about 29% (1 − 1/√2). This is why larger studies produce more precise mean estimates and narrower confidence intervals.
Can I calculate SEM for non-normal data?
Yes — the formula for SEM applies regardless of distribution shape. However, for confidence intervals based on SEM to be valid, the sampling distribution of the mean must be approximately normal. By the Central Limit Theorem, this is satisfied for n ≥ 30, or for smaller n if the original data is approximately normal.
What is the SEM formula used in research and statistics textbooks?
In research, SEM = s / √n, where s is the sample standard deviation and n is the sample size. Some older texts use the notation SE(x̄) or σ/√n (when population SD σ is known). In most applied research, the sample SD s is used since the population SD is rarely known.
Is a higher or lower SEM better for my study?
A lower SEM is better — it means your sample mean is a more precise, reliable estimate of the true population parameter. High SEM values indicate uncertainty, usually due to small sample size or high variability. To reduce SEM, increase your sample size or use more controlled measurement procedures.
The following references support the standard error of the mean formula, confidence interval calculations, and descriptive statistics methods used in this standard error of the mean calculator. For SEM interpretation and reporting standards, see Cumming et al. (2007) and the APA Publication Manual.
- Altman, D. G., & Bland, J. M. (2005). Standard deviations and standard errors. BMJ, 331(7521), 903. https://doi.org/10.1136/bmj.331.7521.903
- American Psychological Association. (2020). Publication manual of the American Psychological Association (7th ed.). APA.
- Cumming, G., Fidler, F., & Vaux, D. L. (2007). Error bars in experimental biology. Journal of Cell Biology, 177(1), 7–11. https://doi.org/10.1083/jcb.200611141
- Field, A. (2018). Discovering statistics using IBM SPSS statistics (5th ed.). SAGE Publications.
- Glantz, S. A. (2012). Primer of biostatistics (7th ed.). McGraw-Hill.
- Greenland, S., Senn, S. J., Rothman, K. J., et al. (2016). Statistical tests, P values, confidence intervals, and power: A guide to misinterpretations. European Journal of Epidemiology, 31, 337–350. https://doi.org/10.1007/s10654-016-0149-3
- Motulsky, H. J. (2014). Intuitive biostatistics (3rd ed.). Oxford University Press.
- R Core Team. (2023). R: A language and environment for statistical computing. R Foundation for Statistical Computing. https://www.R-project.org/
- Samuels, M. L., Witmer, J. A., & Schaffner, A. (2016). Statistics for the life sciences (5th ed.). Pearson.
- Sullivan, L. M. (2008). Estimation from samples. Circulation, 118(7), 742–744. https://doi.org/10.1161/CIRCULATIONAHA.107.747204
- Wasserstein, R. L., & Lazar, N. A. (2016). The ASA statement on p-values: Context, process, and purpose. The American Statistician, 70(2), 129–133. https://doi.org/10.1080/00031305.2016.1154108
- Weiss, N. A. (2016). Introductory statistics (10th ed.). Pearson.


