Simpson's Diversity Index Calculator
Calculate Simpson's Dominance (D), Diversity (1−D), and Inverse Simpson (1/D) from species count data. Includes ecological interpretation, charts, and publication-ready reporting examples.
0 valid values detected
| # | Species / Label | Count |
|---|
0 species entered
Simpson's Index is calculated in three related forms — all derived from the same base formula:
- D — Simpson's Dominance Index: probability two random individuals are the same species (0–1, high = low diversity)
- 1−D — Simpson's Diversity Index: complement of D (0–1, high = high diversity) [most commonly reported]
- 1/D — Inverse Simpson Index: effective number of species (1 to S, high = high diversity)
- nᵢ — Number of individuals of species i
- N — Total number of individuals across all species
- S — Total number of species (species richness)
- Σ — Summation over all S species (i = 1 to S)
- n(n−1) — Number of ways to pick 2 individuals from the same species (sampling without replacement)
| Statistic | Value | Description |
|---|
Species Breakdown
| Rank | Species | Count (nᵢ) | nᵢ(nᵢ−1) | Proportion (pᵢ) | pᵢ² |
|---|
Interpretation Results
How to Write Your Results in Research
▶ Run the analysis above to auto-fill all five examples with your results.
🪧 Research Poster
▶ Run the analysis above to generate your auto-filled research poster.
Extended Formula Derivation
Simpson's Index (1949) is derived from probability theory. D represents the probability that two individuals randomly selected without replacement from a community both belong to the same species. Using the exact (finite-sample) formula D = Σ[nᵢ(nᵢ−1) / N(N−1)] corrects for sampling without replacement. The approximation D = Σpᵢ² (using proportions directly) treats the sample as infinite and is less accurate for small N but used when N is very large.
This calculator uses the exact formula (finite-sample correction) which is recommended for all field ecology datasets. The approximate formula converges with the exact when N is large (>1000).
Three Forms of Simpson's Index
All three forms are computed from the same D value. D (dominance) is counterintuitive because high D = low diversity. For this reason, 1−D is the most commonly reported form in ecology journals — it ranges 0 (single species) to 1 (maximum diversity). 1/D (Inverse Simpson) is preferred in theoretical ecology because it equals the effective number of species and scales linearly rather than being bounded at 1.
Statistical Assumptions
- ✓ Random sampling — all individuals have equal detection probability.
- ✓ Sampling without replacement — the exact formula corrects for this.
- ✓ Community is closed during sampling (no immigration/emigration).
- ✗ Does not account for imperfect detection — use occupancy models for cryptic species.
- ✗ Less sensitive to rare species than Shannon H' — can miss rare-species richness changes.
- ✗ Does not incorporate phylogenetic distance between species.
Decision Checklist
- ✓ You have species count data and dominant species are ecologically important.
- ✓ Sample size is small (N < 50) — Simpson's exact formula is more robust than Shannon H' in this case.
- ✓ You need a bounded 0–1 diversity measure (use 1−D) for intuitive comparison.
- ✓ You want an effective species count interpretation (use 1/D).
- ✗ Do NOT use D (dominance form) in journal results without specifying which form — confusion is common.
- ✗ Do NOT use if rare species are your main conservation target — use Shannon H' instead.
- ✗ Do NOT use presence/absence data — Simpson's Index requires counts.
Real-World Applications
- Wildlife Monitoring: Comparing mammal community structure across habitat types — Simpson's 1-D is robust when camera-trap records are limited (<100 individuals).
- Aquatic Ecology: Macroinvertebrate assemblages as bioindicators of water quality — Simpson's 1-D is a standard in bioassessment protocols (e.g. BMWP).
- Vegetation Science: Comparing plant community dominance across grazing treatments — 1/D gives the effective number of dominant plant species.
- Conservation Planning: Priority-setting across landscape units — sites with low 1−D are candidates for restoration intervention.
Related Metrics — Decision Tree
- 1Enter Your DataIn Free Text mode, type or paste comma-separated species counts (e.g. 52, 48, 55, 61, 47). Switch to Column Entry to assign species names alongside counts — labels feed into charts, tables, and all reporting examples. Upload a .csv or .xlsx file using the Upload tab.
- 2Load a Sample DatasetFive USA ecological datasets are pre-loaded. Load "Great Smoky Mountains Breeding Birds" to see high diversity (1−D ≈ 0.96), or "Tallgrass Prairie Arthropods (Disturbed)" for low diversity (1−D ≈ 0.45). Compare how D, 1−D, and 1/D respond differently to the same data.
- 3Configure SettingsEnter your Study Area name — it auto-fills all interpretation paragraphs and reporting examples. Choose which index form to feature in the summary (1−D is recommended for journal reporting). Set a minimum count to exclude singletons if needed.
- 4Run the AnalysisClick "Calculate Simpson's Diversity Index." The tool computes all three index forms (D, 1−D, 1/D), Berger-Parker dominance, and full species-level contributions simultaneously.
- 5Read Summary CardsFour colour-coded cards show 1−D, 1/D, S, and N. Green = high diversity; amber = moderate; red = low/concerning. Note that 1/D is unbounded — its colour coding is based on percentage of maximum (S).
- 6Examine the Species Breakdown TableEach species shows its count, nᵢ(nᵢ−1) contribution to D, proportional abundance, and pᵢ² value. The dominant species — those with the largest nᵢ(nᵢ−1) — have the greatest effect on D and are ranked first.
- 7Read Both ChartsThe Dominance Plot shows proportional abundance by rank — a flat curve means high evenness and high 1−D. The Proportional Abundance chart highlights the dominant species visually, which directly relates to how D is driven down or up.
- 8Read the InterpretationFive auto-filled paragraphs explain what your D, 1−D, and 1/D values mean, compare to ecological benchmarks, interpret dominance patterns, and note methodological limitations — written for non-specialist audiences.
- 9Copy a Reporting ExampleFive styles: ecology journal, thesis, policy brief, conference abstract, and LTER monitoring. Each is auto-filled with your computed values. Click 📋 Copy on any card to paste directly into your manuscript.
- 10Export ResultsDownload Doc saves a full plain-text report (.txt). Download PDF generates a multi-page A4 report with all sections. Copy Summary copies the one-line significance statement to clipboard.
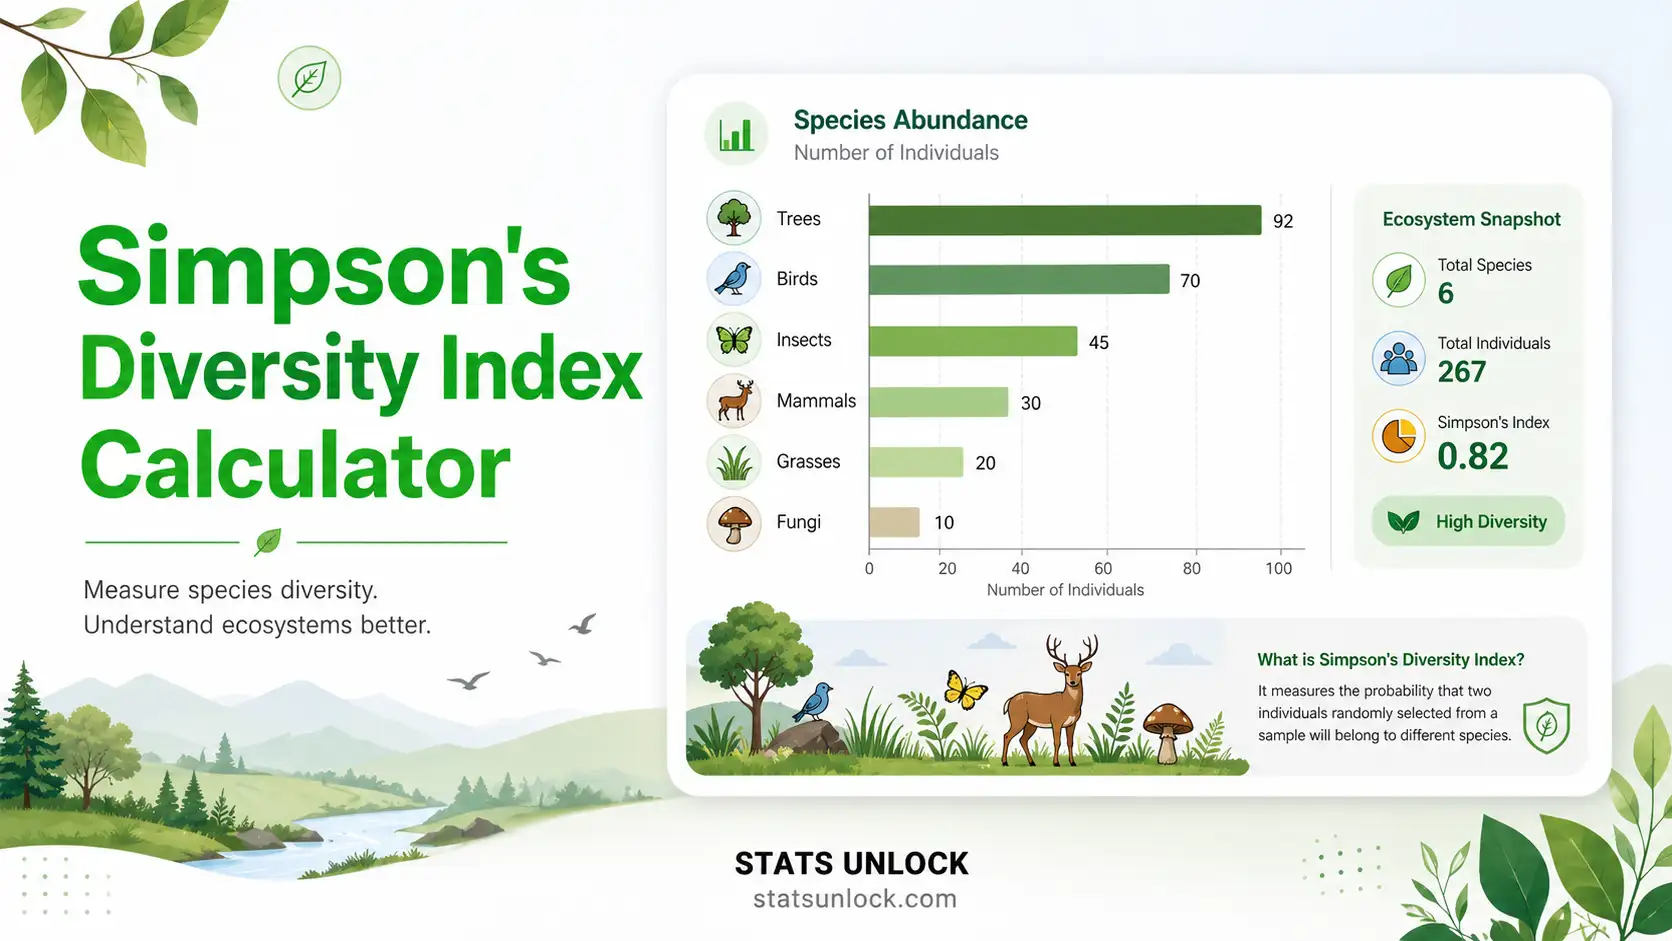
What is Simpson's Diversity Index?
Simpson's Diversity Index is one of the most widely used biodiversity metrics in ecological research, conservation biology, and environmental assessment. First proposed by Edward H. Simpson in 1949, the index measures the probability that two individuals randomly selected from a community belong to the same species. In its most commonly reported form — the complement 1−D — it provides an intuitive 0-to-1 diversity score where values close to 1 indicate a highly diverse, equitable community and values near 0 indicate severe dominance by a single species.
Three Forms — When to Use Each
The index is reported in three interchangeable forms, each suited to a different research question. D (Simpson's Dominance) is the raw probability of same-species pair selection — rarely reported alone because high D counterintuitively means low diversity. 1−D (Simpson's Diversity) is the standard form in ecology journals; it is bounded between 0 and 1 and is easy to communicate to non-specialist audiences. 1/D (Inverse Simpson) is the theoretically preferred form in community ecology because it scales linearly with diversity and equals Hill Number N₂ — the effective number of dominant species. When comparing communities across a wide range of species richness, 1/D is recommended over 1−D because it is not artificially compressed near 1 for species-rich communities.
Key Ecological Thresholds
While absolute thresholds depend on the taxonomic group, habitat type, and regional context, published benchmarks provide a useful reference framework. Communities with 1−D ≥ 0.85 are typically intact, low-disturbance assemblages where no single taxon dominates — characteristic of tropical forests, diverse coral reefs, and old-growth vegetation. Values of 0.65–0.85 indicate moderately diverse communities with some competitive hierarchy, common in temperate forests and selectively managed habitats. 0.40–0.65 signals notable dominance and is typical of recovering, fragmented, or edge habitats. Values below 0.40 indicate severely impoverished communities associated with chronic disturbance, invasive species pressure, or intensive land use — contexts where active conservation intervention is warranted.
Strengths and Limitations
Simpson's Index has several important advantages over other diversity metrics. It is robust to small sample sizes — the exact finite-sample formula D = Σ[nᵢ(nᵢ−1)/N(N−1)] corrects for sampling without replacement, making it more reliable than Shannon H' when N is small. It is also intuitive and bounded, easy to explain to policymakers, land managers, and funders who need a simple summary of community health. Its sensitivity to dominant species makes it particularly appropriate for detecting early signs of dominance shifts caused by invasive species establishment, selective logging, or eutrophication.
The primary limitation is its relative insensitivity to rare species. A community with 1 very abundant species and 50 rare species can yield a lower 1−D than a community of 10 equally abundant species — even if the former is ecologically richer. For assessments where rare or threatened species are the primary conservation focus, Shannon H' or species-level IUCN analyses should complement Simpson's Index. Additionally, like all diversity indices, Simpson's D assumes equal detection probability across species — a condition rarely met in field surveys of cryptic, nocturnal, or semi-aquatic taxa.
Reporting Best Practices
Always specify which form of the index you are reporting — D, 1−D, or 1/D — as they have opposite directionality and frequent confusion in the literature causes misinterpretation. The recommended reporting format for ecology journals is: "Community diversity was high (Simpson's 1−D = 0.94; D = 0.06; 1/D = 16.7; S = 28 species; N = 412 individuals; Simpson, 1949)." Report species richness (S) and total individuals (N) alongside the index. For multi-site comparisons, state whether rarefaction or bootstrapped confidence intervals were used. When publishing results generated with this tool, verify calculations using the R vegan package (diversity(x, index = "simpson")) and cite both Simpson (1949) and Magurran (2004) as primary methodological references.
How This Tool Supports Your Research
The StatsUnlock Simpson's Diversity Index Calculator is designed to streamline the biodiversity assessment workflow from raw field data to publication-ready output. By supporting comma-separated text input, structured column entry with species labels, CSV/Excel file upload with dual column mapping, and manual species-by-species entry, the tool accommodates data from point counts, camera traps, vegetation quadrats, transect surveys, and aquatic sampling programmes. The auto-filled five-paragraph ecological interpretation, five reporting example templates, full-results PDF export, and research poster generator significantly reduce the time from data entry to manuscript-ready output — without sacrificing methodological rigour.
For questions about the methodology, suggestions for additional features, or to report any issues with the calculator, visit StatsUnlock.com.
Q1. What is Simpson's Diversity Index and when should I use it?
Simpson's Index measures the probability that two randomly selected individuals from a community belong to the same species. The complement (1−D) converts this into an intuitive diversity score from 0 (no diversity) to 1 (maximum diversity). Use it when dominant species are ecologically relevant, when sample sizes are small, or when you need a bounded, intuitive diversity score robust to rare species under-sampling.
Q2. What data do I need to calculate Simpson's Diversity Index?
You need species count data — the number of individuals per species from a defined sampling effort. Minimum: 2 species and at least 5 total individuals (though N > 30 gives more reliable estimates). The exact formula D = Σ[nᵢ(nᵢ−1)/N(N−1)] corrects for small sample size better than the Shannon formula, making Simpson's preferred for community surveys with limited effort.
Q3. What does a high vs low 1−D value mean ecologically?
1−D close to 1 (e.g. ≥0.8): Very high diversity — multiple species co-exist with similar abundances, no single taxon dominates. Typical of intact tropical habitats.
1−D 0.5–0.8: Moderate diversity — some dominance present. Common in temperate or recovering habitats.
1−D <0.5: Low diversity — one or few species dominate. Associated with disturbance, degradation, or early succession.
1−D near 0: Single species dominates — monoculture-like community.
Q4. How does Simpson's Index differ from Shannon-Wiener Index?
Shannon H' weights rare species more heavily through its logarithmic formula — adding a rare species increases H' substantially. Simpson's 1-D weights dominant species more heavily — dominated communities have low 1-D regardless of how many rare species exist.
Simpson's is more robust with small N and less affected by sampling incompleteness. Shannon is preferred when rare species are conservation targets. For most community-level biodiversity studies, reporting both provides the fullest picture.
Q5. What are the three forms of Simpson's Index and which should I report?
D (Dominance): 0–1, high = low diversity. Counterintuitive — rarely reported alone.
1−D (Diversity): 0–1, high = high diversity. Most commonly reported in ecology journals. Always specify "Simpson's 1−D" not just "Simpson's Index."
1/D (Inverse Simpson): Ranges 1 to S. Equal to Hill Number N₂ — preferred in theoretical ecology because it scales linearly and is interpretable as effective species number. Recommended when comparing communities across a wide richness range.
Q6. How much sampling effort do I need for a reliable estimate?
The exact formula corrects for sample size, making Simpson's more reliable than Shannon H' with small N. A minimum of 5 individuals per species and N > 10 total is a practical floor. For robust site comparisons, aim for N > 30 and use rarefaction when sites have very different total abundances. Unlike Shannon H', Simpson's 1-D does not systematically underestimate diversity with small samples.
Q7. Can I compare 1−D values between sites?
Yes — 1−D is bounded 0–1 and less sensitive to sample size than Shannon H', making cross-site comparison more straightforward. However, standardised sampling effort is still essential. For formal statistical comparisons, use bootstrapped confidence intervals or jackknife estimates. The R vegan package provides both via the diversity() function with index='simpson'.
Q8. How do I report Simpson's Index in an ecology journal?
Always specify which form: "Community diversity was high (Simpson's 1−D = 0.94; D = 0.06; 1/D = 16.7; S = 28 species, N = 412 individuals)." Never report "Simpson's Index = 0.94" without specifying 1−D, as D = 0.94 means the opposite (very low diversity). See the five reporting examples in the Interpretation section for full journal, thesis, policy, abstract, and monitoring formats.
Q9. Can I use this for published research or a thesis?
This tool is designed for educational use and field exploration. For formal publication, verify results with the R vegan package: diversity(x, index='simpson') returns 1−D directly. Cite as: StatsUnlock. (2025). Simpson's Diversity Index Calculator. Retrieved from https://statsunlock.com/ecology/simpsons-diversity-index-calculator. The calculation follows Simpson (1949) and Magurran (2004).
Q10. My D value is unexpectedly high — what might be wrong?
High D (close to 1) means very low diversity — one species dominates. Common causes: one species count far exceeds all others (check the Species Breakdown table for the top-ranked species); very few species entered (S = 2–3 always gives relatively high D); or a total was entered as one of the species counts. Load the Great Smoky Mountains Breeding Birds sample dataset and confirm 1−D ≈ 0.96 to verify the calculator is working correctly.
Q11. What is the Inverse Simpson's Index (1/D) and why is it useful?
1/D is the reciprocal of Simpson's D. It equals the effective number of equally abundant species that would produce the same D value — a community with 1/D = 8.0 is statistically as diverse as one with eight perfectly even species, even if it actually has more.
It ranges from 1 (a single dominant species) up to S (all species equally abundant). 1/D is recommended over 1−D when comparing communities of very different species richness, because it scales linearly with diversity rather than being bounded between 0 and 1. This linearity also makes 1/D easier to interpret in statistical models and easier to compare across studies that report Hill numbers (where 1/D = Hill N₂).
The following references support the methods used in this calculator, covering species dominance, diversity measurement, and best practices in ecological sampling.
- Simpson, E. H. (1949). Measurement of diversity. Nature, 163, 688. https://doi.org/10.1038/163688a0
- Magurran, A. E. (2004). Measuring biological diversity. Blackwell Publishing.
- Shannon, C. E., & Weaver, W. (1949). The mathematical theory of communication. University of Illinois Press.
- Hill, M. O. (1973). Diversity and evenness: A unifying notation and its consequences. Ecology, 54(2), 427–432. https://doi.org/10.2307/1934352
- Jost, L. (2006). Entropy and diversity. Oikos, 113(2), 363–375. https://doi.org/10.1111/j.2006.0030-1299.14714.x
- Krebs, C. J. (1999). Ecological methodology (2nd ed.). Benjamin Cummings.
- Gotelli, N. J., & Colwell, R. K. (2001). Quantifying biodiversity. Ecology Letters, 4(4), 379–391. https://doi.org/10.1046/j.1461-0248.2001.00230.x
- Chao, A., & Jost, L. (2012). Coverage-based rarefaction and extrapolation. Ecology, 93(12), 2533–2547. https://doi.org/10.1890/11-1952.1
- Oksanen, J., et al. (2022). vegan: Community ecology package. R package version 2.6-4. https://CRAN.R-project.org/package=vegan
- Pielou, E. C. (1966). The measurement of diversity in different types of biological collections. Journal of Theoretical Biology, 13, 131–144.
- Bibby, C. J., Burgess, N. D., Hill, D. A., & Mustoe, S. H. (2000). Bird census techniques (2nd ed.). Academic Press.
- R Core Team. (2024). R: A language and environment for statistical computing. R Foundation. https://www.R-project.org/
- Colwell, R. K. (2013). EstimateS: Statistical estimation of species richness. http://purl.oclc.org/estimates


